Puntalytics
Our Metrics
Puntalytics was founded out of a frustration with the metrics typically used to evaluate punters. As we’ll explain below, Gross Yards per Punt and Net Yards per Punt leave a lot to be desired; other metrics (like Percent of Punts Inside the 20 and Touchback Percentage) can help fill in the gaps, but still don’t give a complete picture. Applying traditional EPA to punting is a disaster. The metrics below are our humble attempt at carrying puntalytics into the data science age along with the rest of football.
EPA/punt
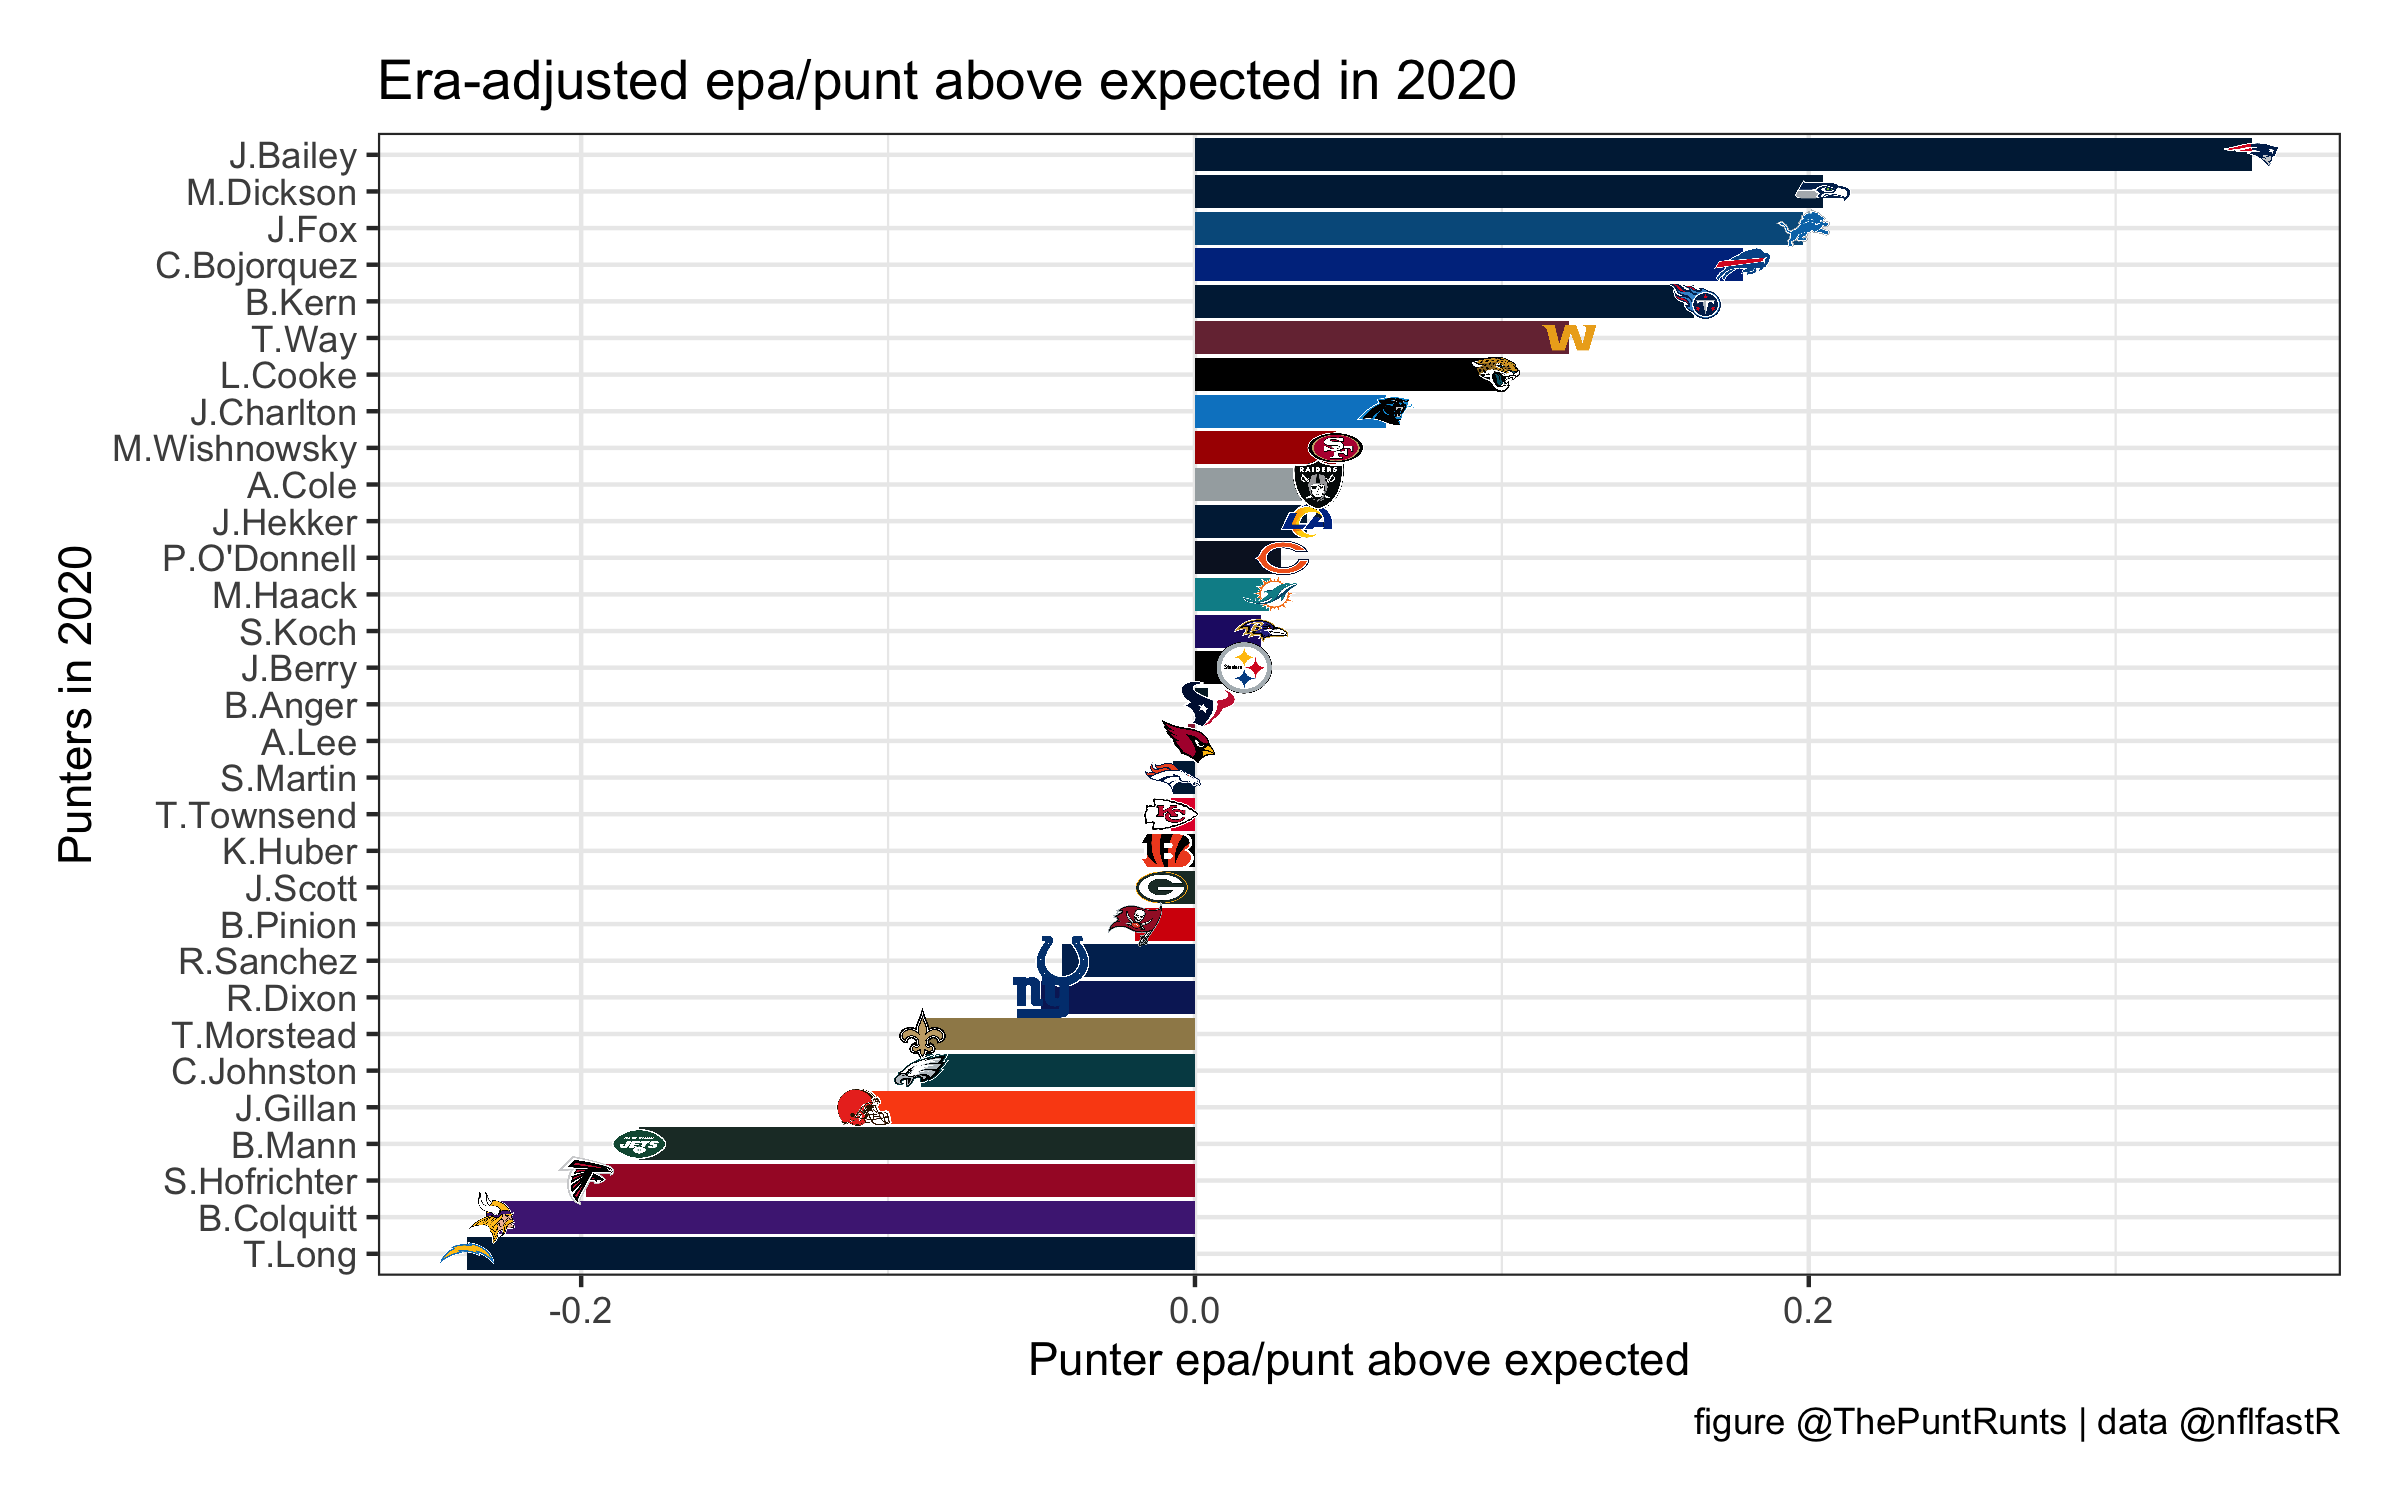
Before we get to all the nitty gritty below, here are 2020 punters ranked by era-adjusted EPA above expected/punt! That’s EAEPAAE/P, officially the world’s worst acronym.
 The go-to stat in the modern analytics community is EPA - expected points added. Read about EPA here, among other places.
There are a few big hurdles to using EPA for punting. First, the yards-to-go on fourth down when the punt is called is a huge, huge factor. It’s essentially impossible for a punter to log positive EPA on a 4th&1 punt; otherwise put, don’t punt on 4th&1! More generally, there are many factors influencing traditional EPA (score, time remaining, etc.) that are out of the punter’s control. Our model sidesteps this issue by averaging EP values across the entire nflfastR dataset to get a game-script-independent EP value for having a 4th down on each yard line, and similarly, an EP value for having a 1st down on each yard line.
This is enough information to start assigning EPA values to punts. For example, having a 4th down at your own 20 yard line is worth on average -2 expected points (the negative value means that your opponent is more likely to score next). Now, you punt 50 yards, giving your opponent the ball on their 30. Your opponent’s first down from their own 30 is worth on average 1.3 expected points for them, or -1.3 expected points for you. This means that you’ve improved your team’s fortunes by 0.7 points! Using this approach, a punt from yard line X to yard line Y will always be worth the same EPA in our model.
However, in pin-deep territory, high-EPA punts are still largely impossible. This makes football sense: punting in pin-deep territory tends to be worth negative EPA, because you’d probably be better off going for it or kicking a long field goal. But again, coaching decisions aren’t the punter’s responsibility. When that questionable punt call is made, there is some “expected EPA” that the coach can hope to get, which is represented in the above plot by the blue line. All the punter can do is exceed that expectation, e.g. achieve and EPA higher than that blue line. The resulting stat, EPA above expected/punt or EPAAE/punt, is the difference between that blue line and the punter’s actual performance.
Era adjustment
Over the 21 seasons present in the nflfastR data set, punting has changed a surprising amount. Punters are kicking quite a bit farther than they did in 1999, and they’re also being called on to punt in different situations. As such, it became clear that best practice was to era-adjust our stats; essentially, this means that a separate version of the blue line in the above plot is created for each season. As the data shifts, so do our stats. SHARP, discussed below, is also calculated on a year-by-year basis. Era-adjustment has the notable affect of catapulting Shane Lechler to the top in many of our metrics
A non-EPA-specific issue with puntalytics is that it’s hugely influenced by plays with large returns or turnovers, especially those that result in touchdowns. We account for this by basing our EPA model on RERUN:
RERUN - Return-Edited Real Unbiased Net
Every time a dynamic returner goes off for 20+ yds, we think, was that the punter's fault? And even in less extreme cases, are we swaying our evaluations of punters based on the quality of the coverage team in front of them? We'll spend this thread musing on that question
— Puntalytics (@ThePuntRunts) March 5, 2020
As we muse in this twitter thread, it seems unfair to blame punters for the occasional 20-plus-yard return. To adjust for this, we filter punts into ‘returned’ and ‘not returned’, and assign all ‘returned’ punts an average return, rather than whatever return actually happened.
SHARP - Scrimmage Help/Hurt Adjusted Real Punting
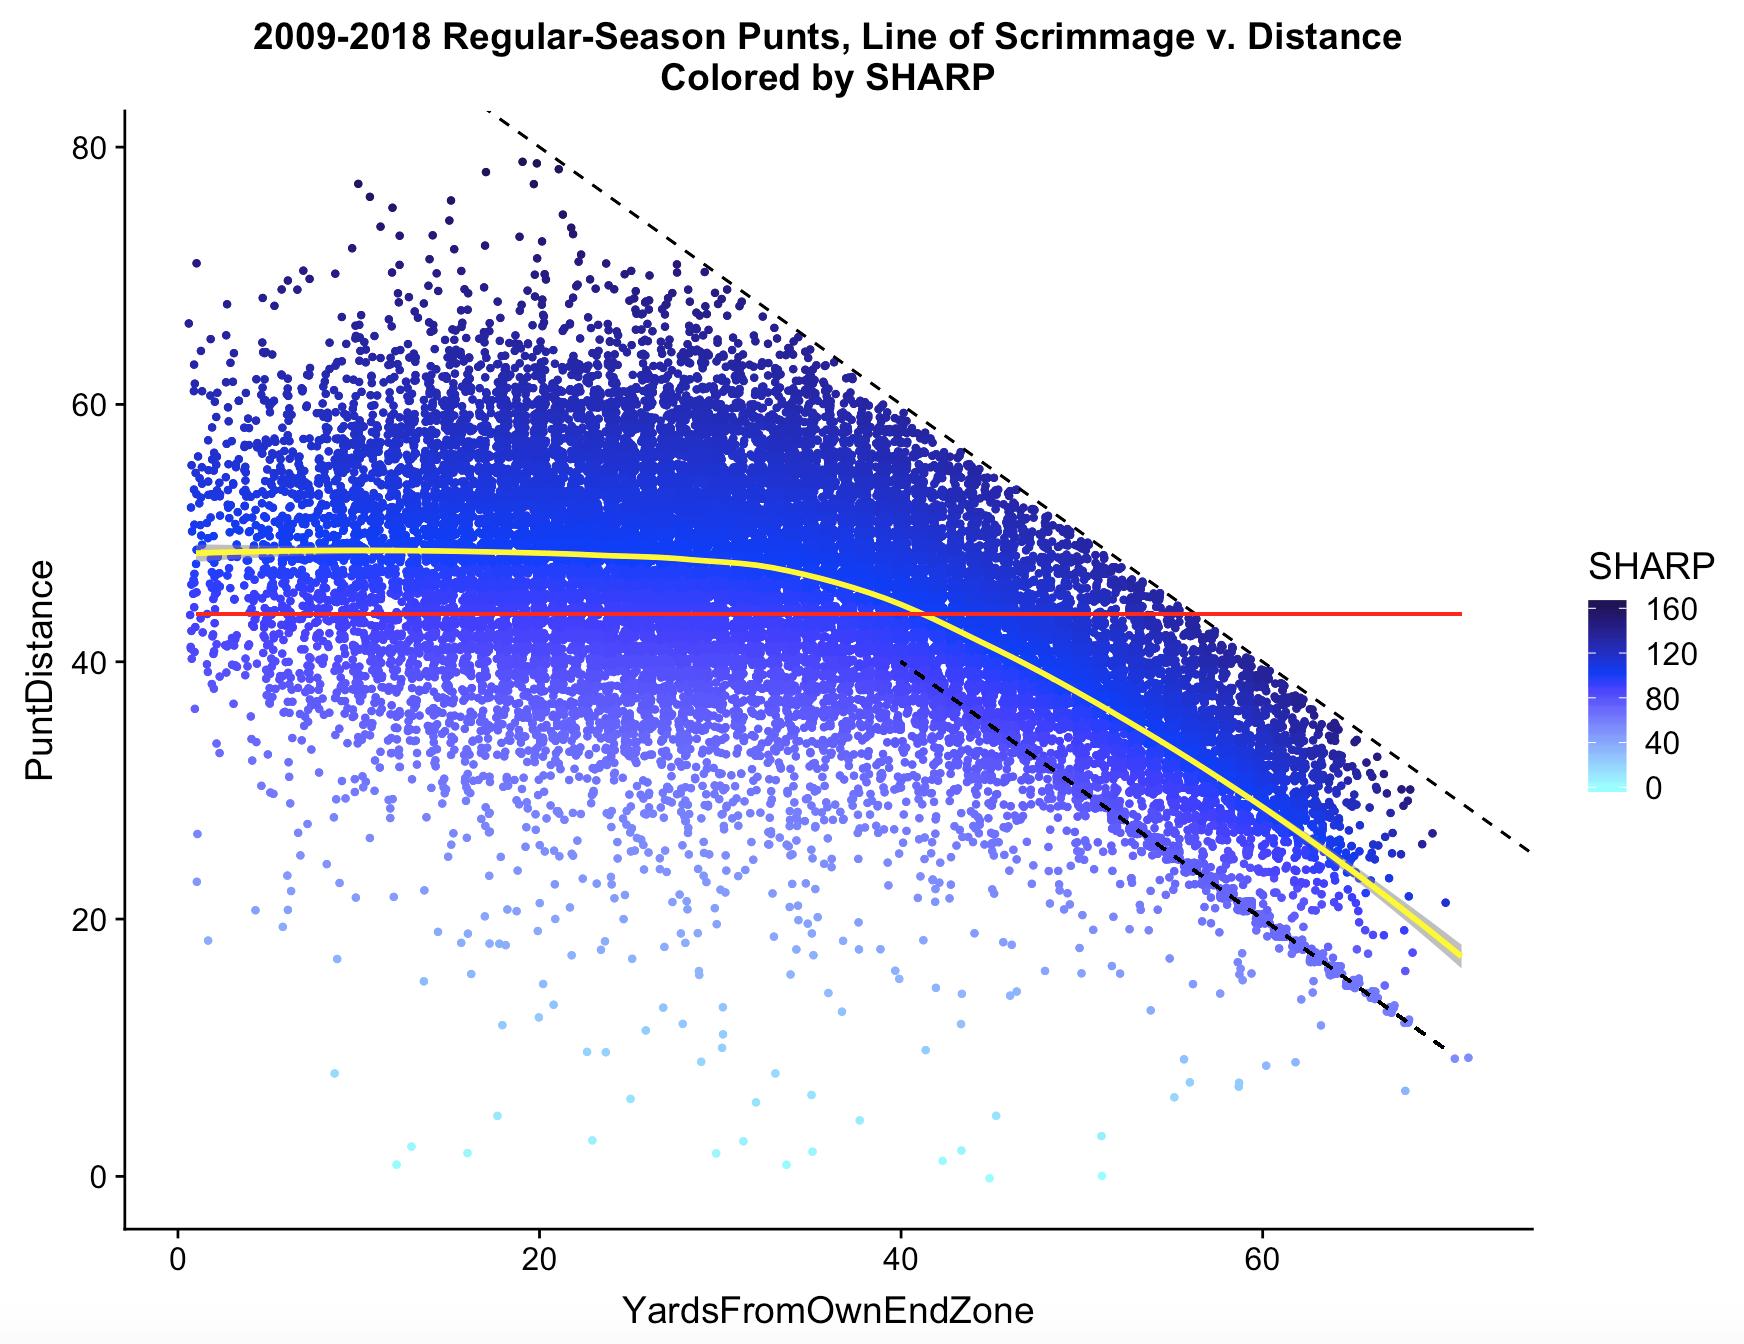 In contrast with the modern analytics community and its affinity for EPA, the go-to stat for describing punters in mainstream football media is gross yards/punt. The big(gest) inherent problem with gross yards/punt is, at certain field positions, the punter’s goal is pin the opponent deep while avoiding a touchback, rather than kicking as far as possible. In these situations, a punter’s average can be dinged for a short (say, 35 yard) punt, even when that punt was excellent. To adjust for this, we compute the (smoothed) average punt distance from that yard line, represented in the above graph as a yellow line. Compare that with the red line, showing the length of an “average punt” without considering field postion. SHARP is then calculated as Distance / Average Distance from that yard line. We wrote about this at length in a BleedingGreenNation fanpost.
SHARPnet and SHARP RERUN
Another problem with gross yards/punt is that it doesn’t consider returns. SHARP inherits that shortcoming, so we often instead use SHARPnet. SHARPnet is calculated just like SHARP, but with a base of Net Yards instead than Gross Yards. Likewise, we can compute SHARP RERUN.