Puntalytics
Plots & Tables
Someday, this page might be interactive, in the style of RBSDM. In the mean time, enjoy a whole bunch of stuff to scroll through! For more details about our metrics, head here.
Stats this season (2025)
Here’s how things stand this season; this table and the graph below will automatically update at 6 AM eastern after TNF, SNF, and MNF.
| Punters in 2025, ranked by pEPA | ||||||||
| Team | Punter | NumPunts | pEPA | Gross | Net | RERUN | OF | PD |
|---|---|---|---|---|---|---|---|---|
 |
D.Whelan | 49 | 0.18 | 48.43 | 43.90 | 43.78 | 109.47 | 97.20 |
 |
M.Dickson | 52 | 0.17 | 47.85 | 42.17 | 44.19 | 106.77 | 101.02 |
 |
M.Haack | 25 | 0.16 | 51.32 | 43.40 | 45.37 | 104.70 | 109.57 |
 |
R.Wright | 65 | 0.13 | 48.06 | 44.51 | 44.11 | 105.31 | 99.69 |
 |
J.Stout | 53 | 0.10 | 47.87 | 44.87 | 43.44 | 104.59 | 96.79 |
|
B.Gillikin | 22 | 0.09 | 49.91 | 45.41 | 43.92 | 105.19 | 97.47 |
 |
R.Sanchez | 44 | 0.08 | 47.41 | 44.68 | 43.41 | 102.42 | 103.08 |
 |
S.Martin | 56 | 0.07 | 46.11 | 40.52 | 41.92 | 103.31 | 101.00 |
 |
R.Rehkow | 65 | 0.07 | 47.15 | 42.89 | 42.35 | 104.75 | 97.36 |
 |
J.Fox | 56 | 0.07 | 45.91 | 42.82 | 42.16 | 101.54 | 104.44 |
 |
A.McNamara | 71 | 0.07 | 45.03 | 43.15 | 42.21 | 100.73 | 104.26 |
 |
J.Scott | 60 | 0.06 | 46.52 | 41.43 | 42.92 | 102.17 | 98.21 |
 |
J.Bailey | 63 | 0.05 | 46.75 | 42.63 | 42.83 | 100.97 | 103.64 |
 |
M.Araiza | 56 | 0.05 | 46.50 | 41.30 | 42.28 | 102.21 | 102.20 |
 |
T.Way | 56 | 0.05 | 45.91 | 43.88 | 41.61 | 101.12 | 103.23 |
 |
M.Wishnowsky | 38 | 0.02 | 43.76 | 41.95 | 41.25 | 100.39 | 100.81 |
 |
T.Townsend | 72 | 0.02 | 46.17 | 41.64 | 41.58 | 100.58 | 101.12 |
 |
T.Taylor | 60 | 0.00 | 45.50 | 40.40 | 41.35 | 101.16 | 97.32 |
 |
A.Cole | 71 | -0.01 | 46.46 | 40.83 | 41.94 | 97.44 | 105.73 |
 |
J.Crawshaw | 75 | -0.01 | 45.24 | 41.13 | 41.46 | 99.68 | 98.71 |
 |
E.Evans | 50 | -0.01 | 44.70 | 37.98 | 40.73 | 99.23 | 100.64 |
 |
B.Mann | 72 | -0.02 | 47.65 | 42.79 | 42.75 | 101.10 | 92.42 |
 |
L.Cooke | 60 | -0.03 | 45.97 | 43.00 | 41.31 | 100.30 | 96.73 |
 |
B.Anger | 41 | -0.05 | 48.63 | 42.63 | 42.45 | 98.14 | 101.21 |
 |
B.Baringer | 51 | -0.06 | 45.80 | 40.61 | 41.12 | 99.19 | 95.77 |
 |
C.Waitman | 62 | -0.09 | 44.56 | 41.74 | 40.91 | 97.19 | 97.50 |
 |
B.Pinion | 64 | -0.09 | 44.20 | 40.59 | 39.89 | 96.01 | 98.88 |
 |
R.Dixon | 63 | -0.11 | 43.41 | 40.16 | 39.70 | 96.01 | 98.37 |
 |
J.Hekker | 78 | -0.12 | 45.04 | 40.35 | 40.59 | 96.61 | 96.01 |
 |
T.Morstead | 44 | -0.12 | 43.16 | 36.77 | 38.96 | 94.67 | 98.90 |
 |
C.Bojorquez | 91 | -0.15 | 43.35 | 37.62 | 39.17 | 96.35 | 92.47 |
 |
J.Gillan | 55 | -0.18 | 43.00 | 37.96 | 39.02 | 94.80 | 93.66 |
 |
K.Kroeger | 56 | -0.20 | 43.41 | 38.62 | 39.27 | 93.16 | 95.01 |
| 'OF and 'PD' are SHARP_RERUN scores for Open-field and pin-deep, respectively | ||||||||
| Updated 2026-05-25 05:59:16.780366 eastern | ||||||||
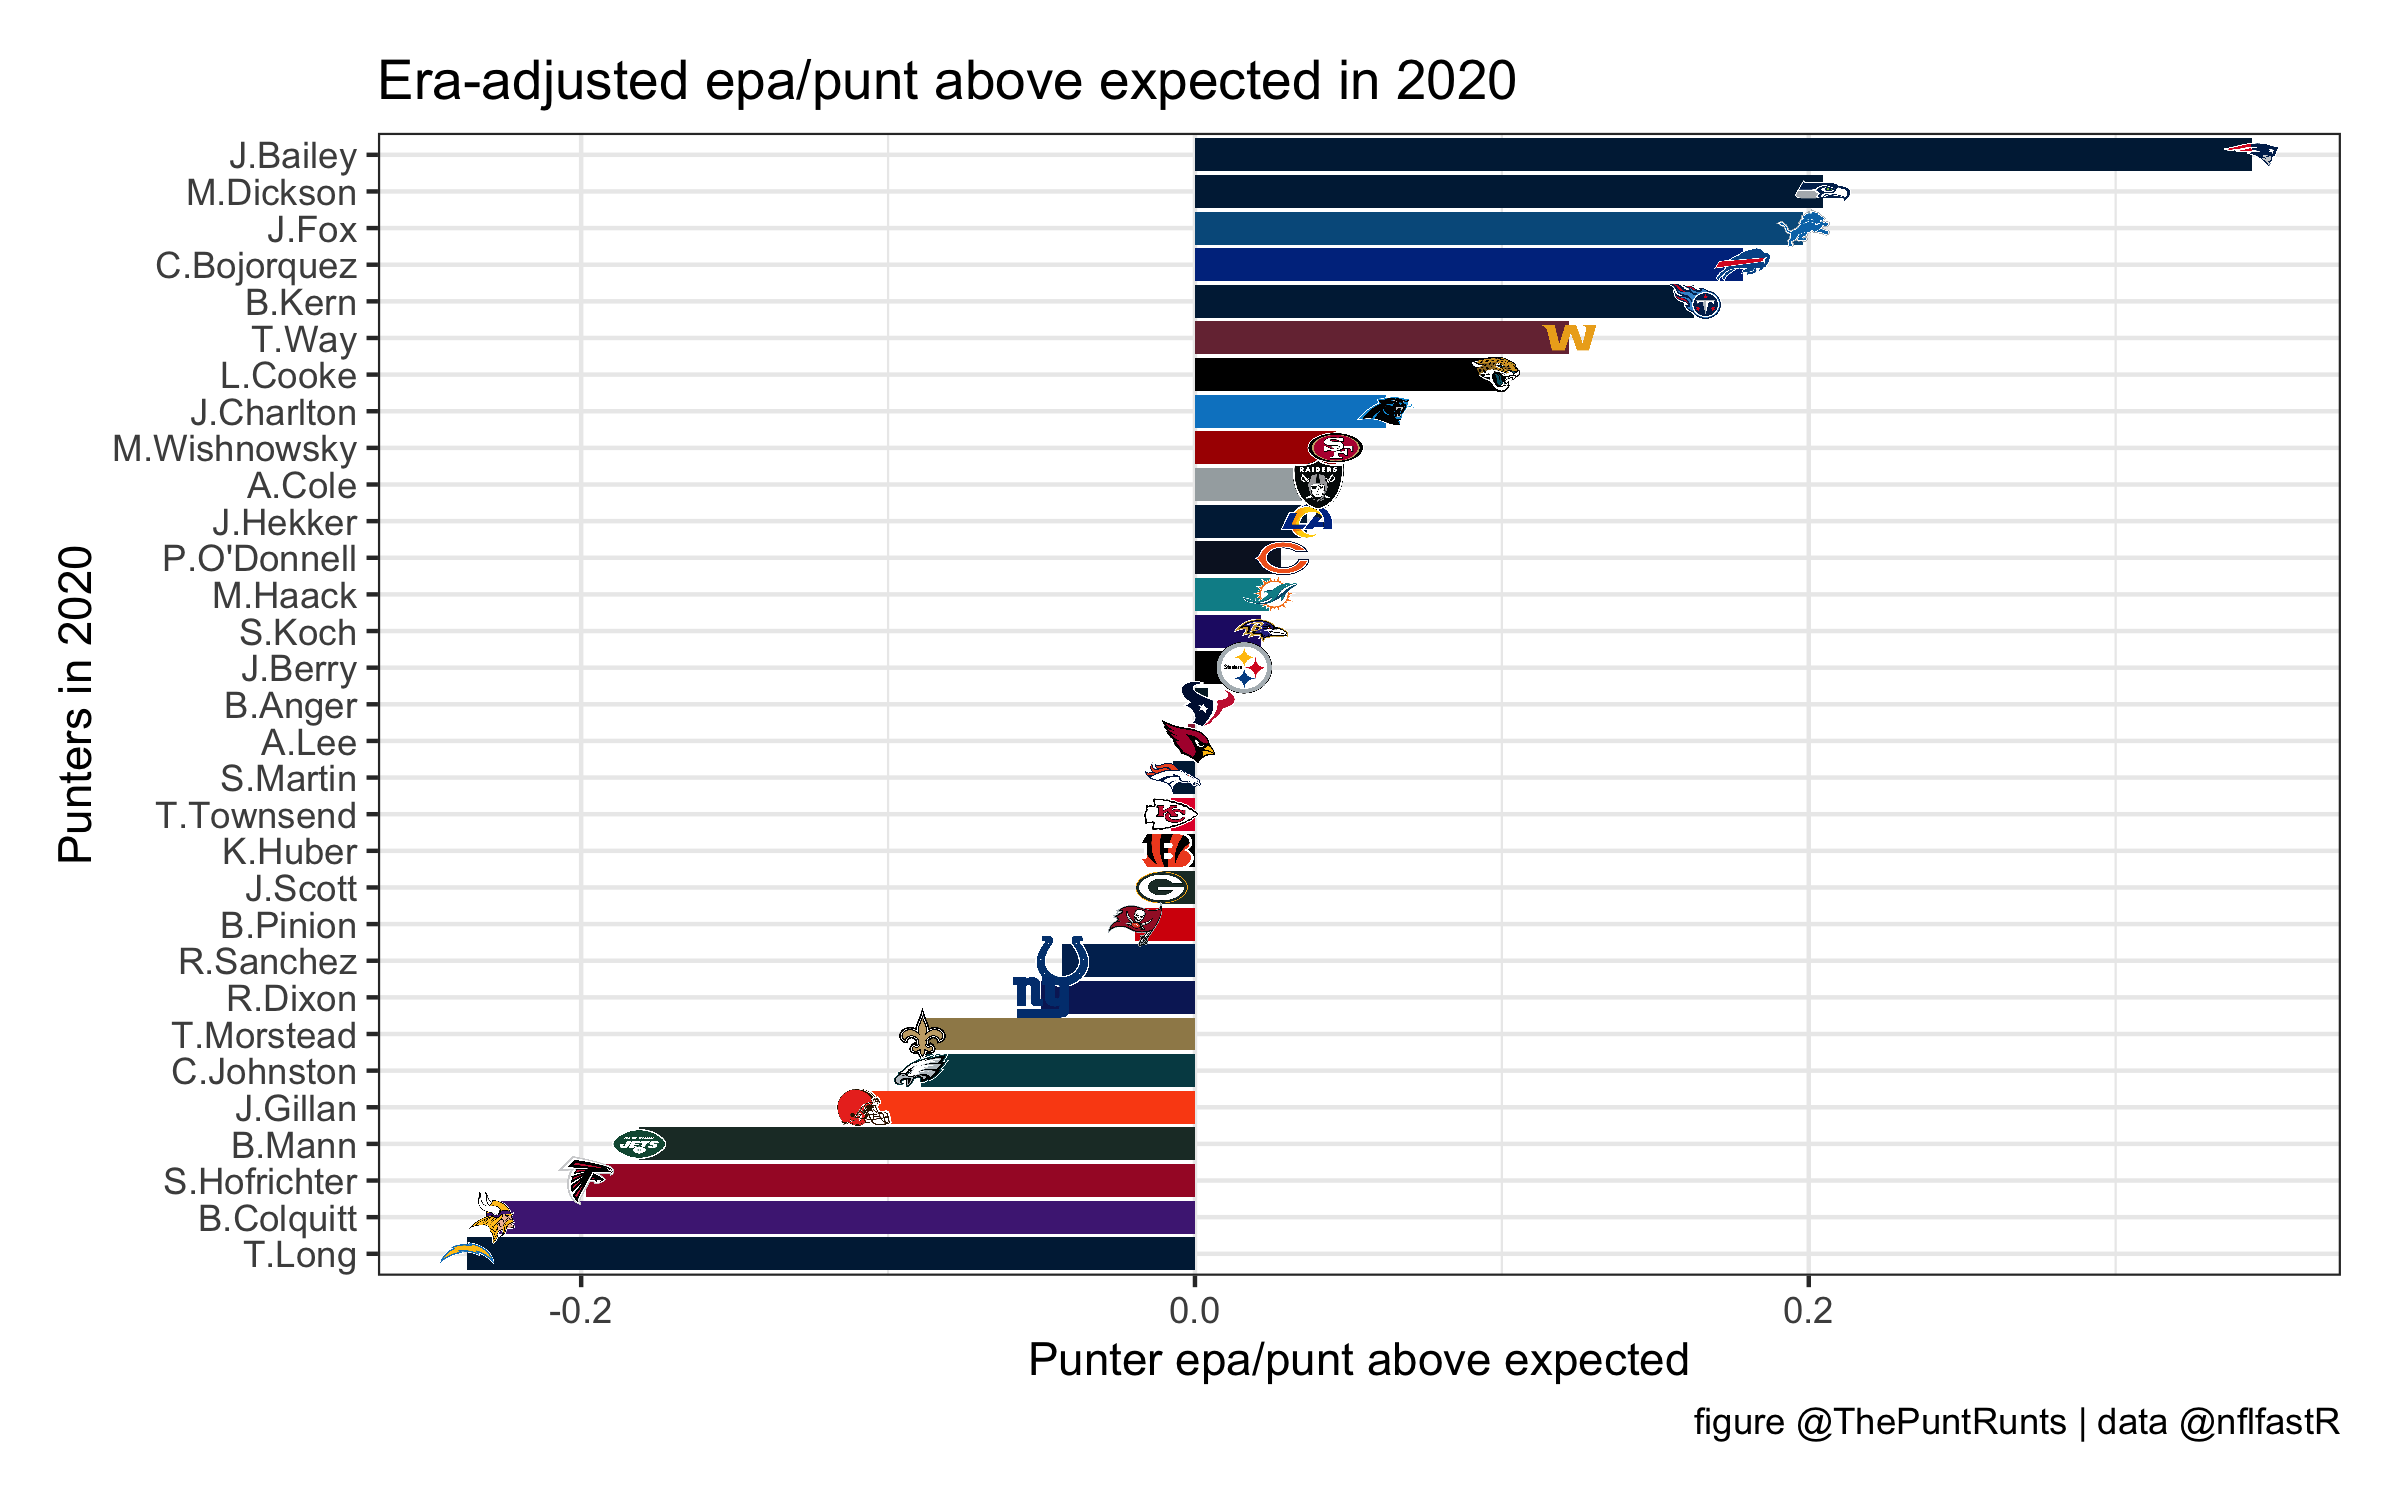
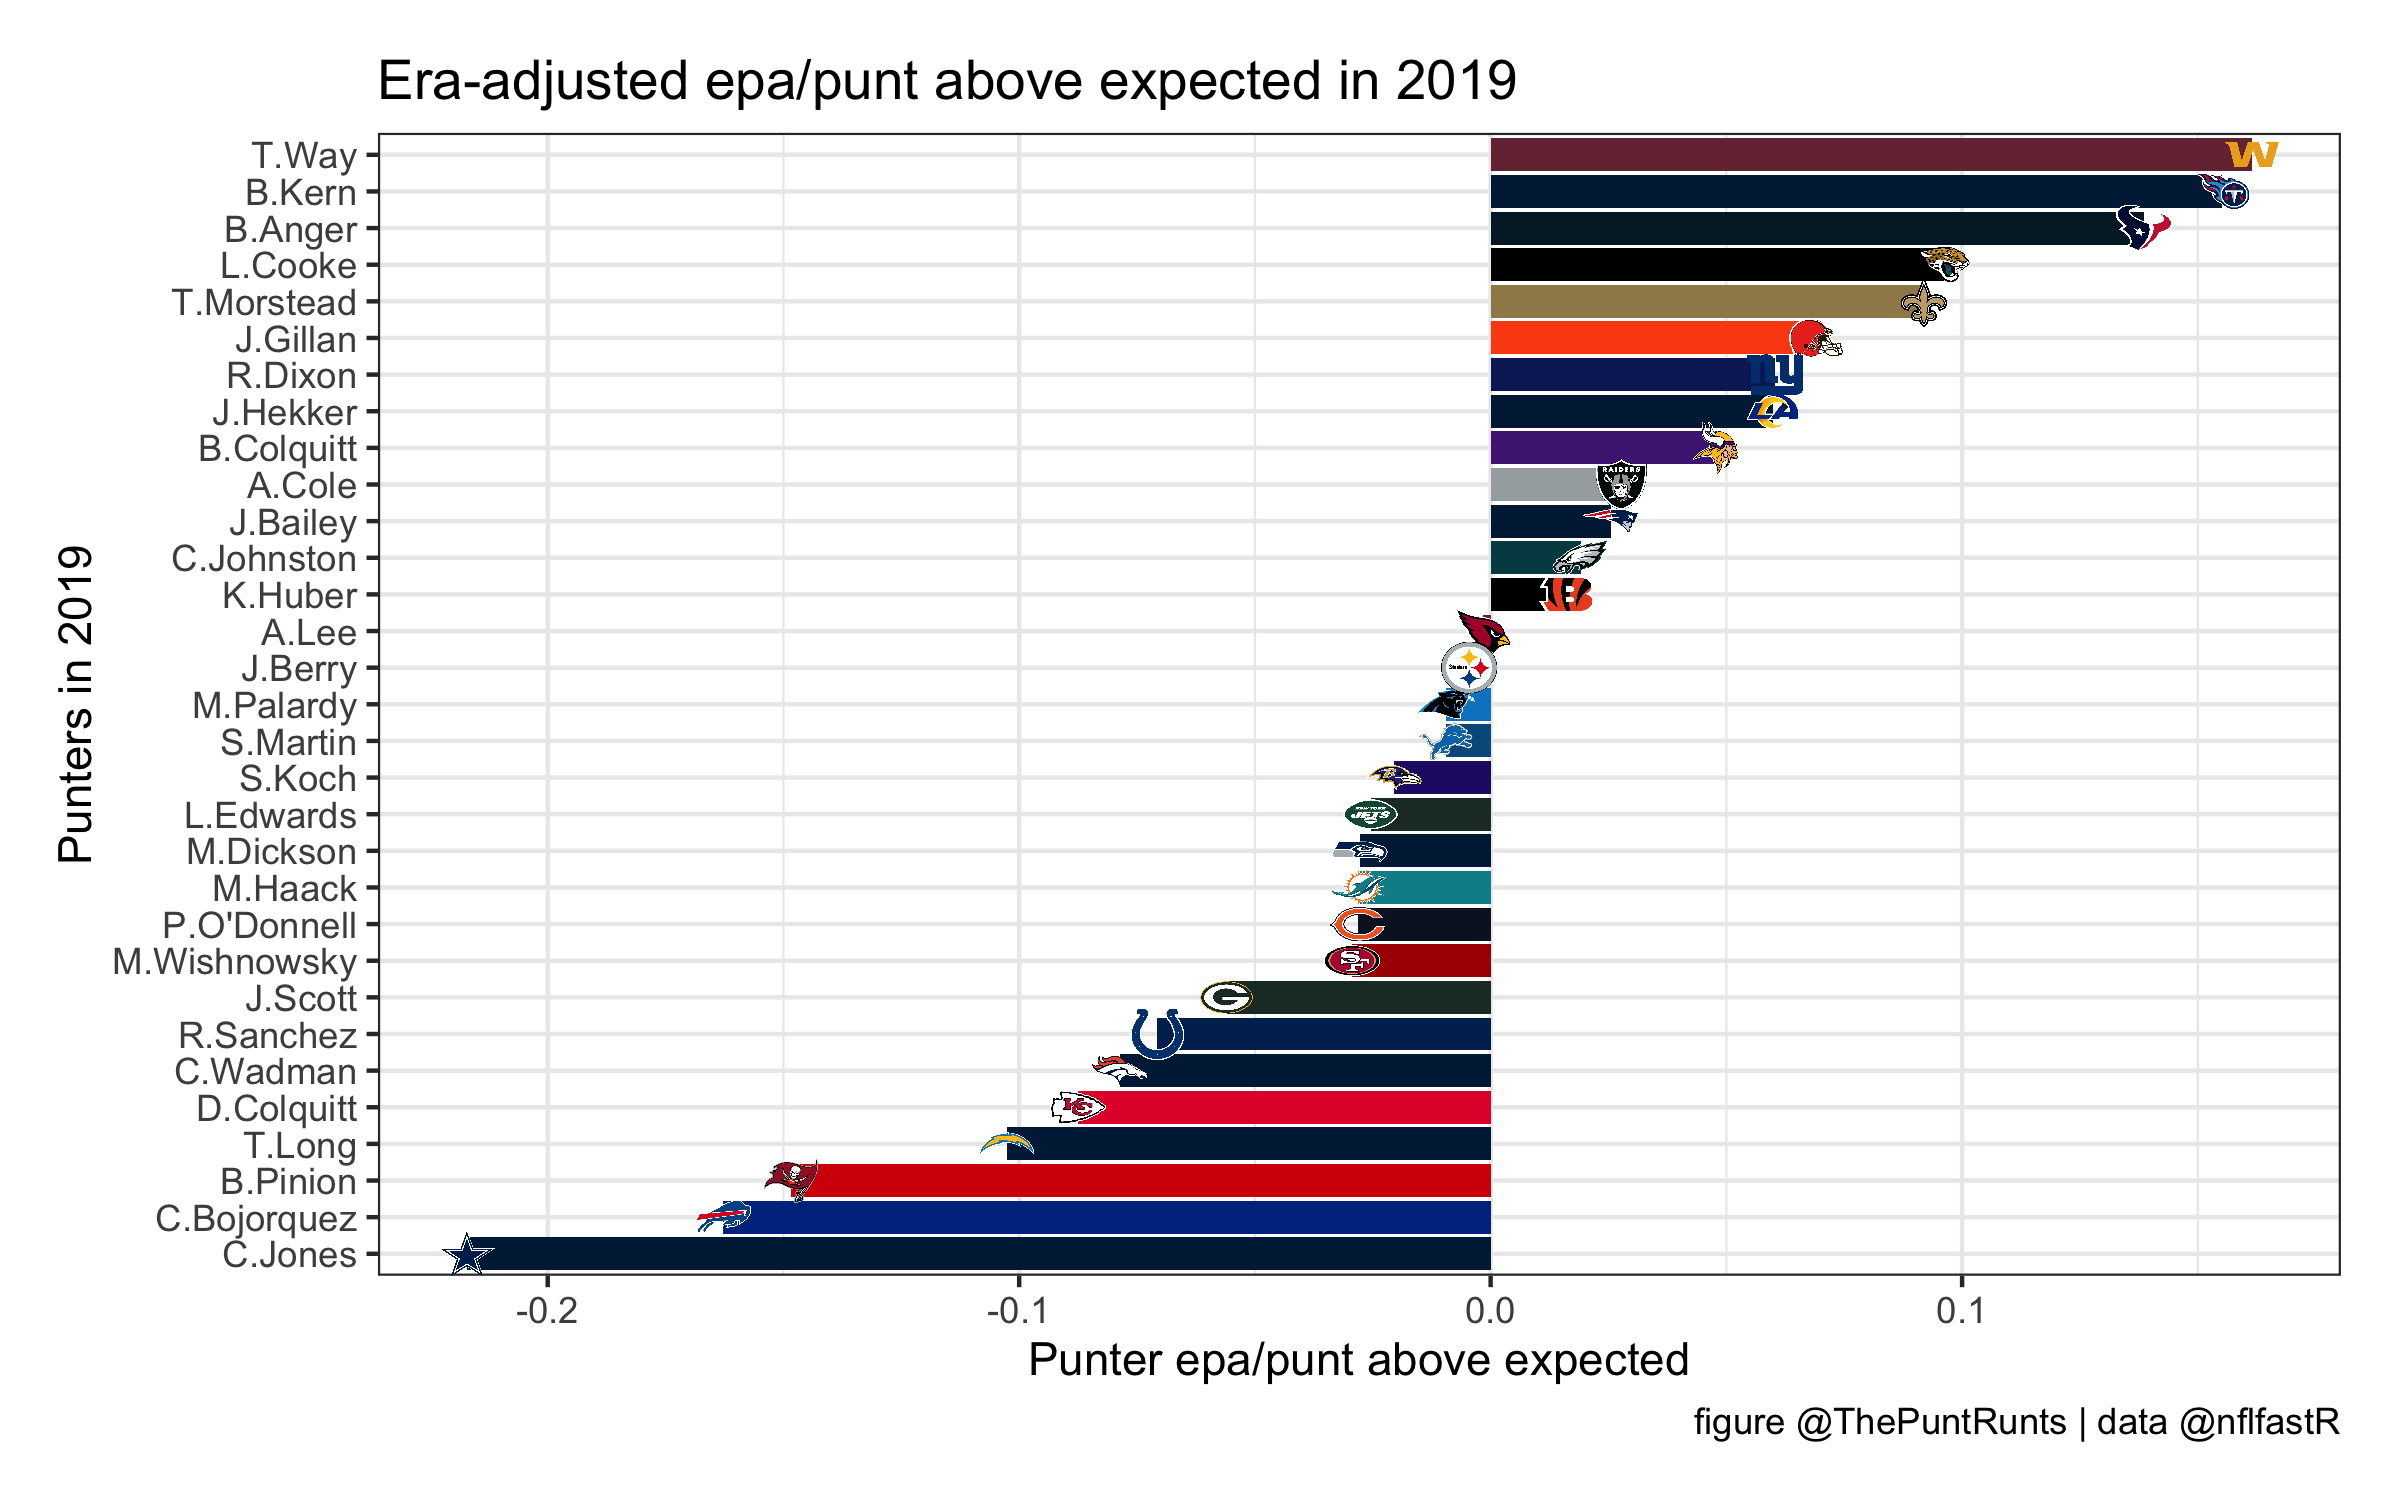
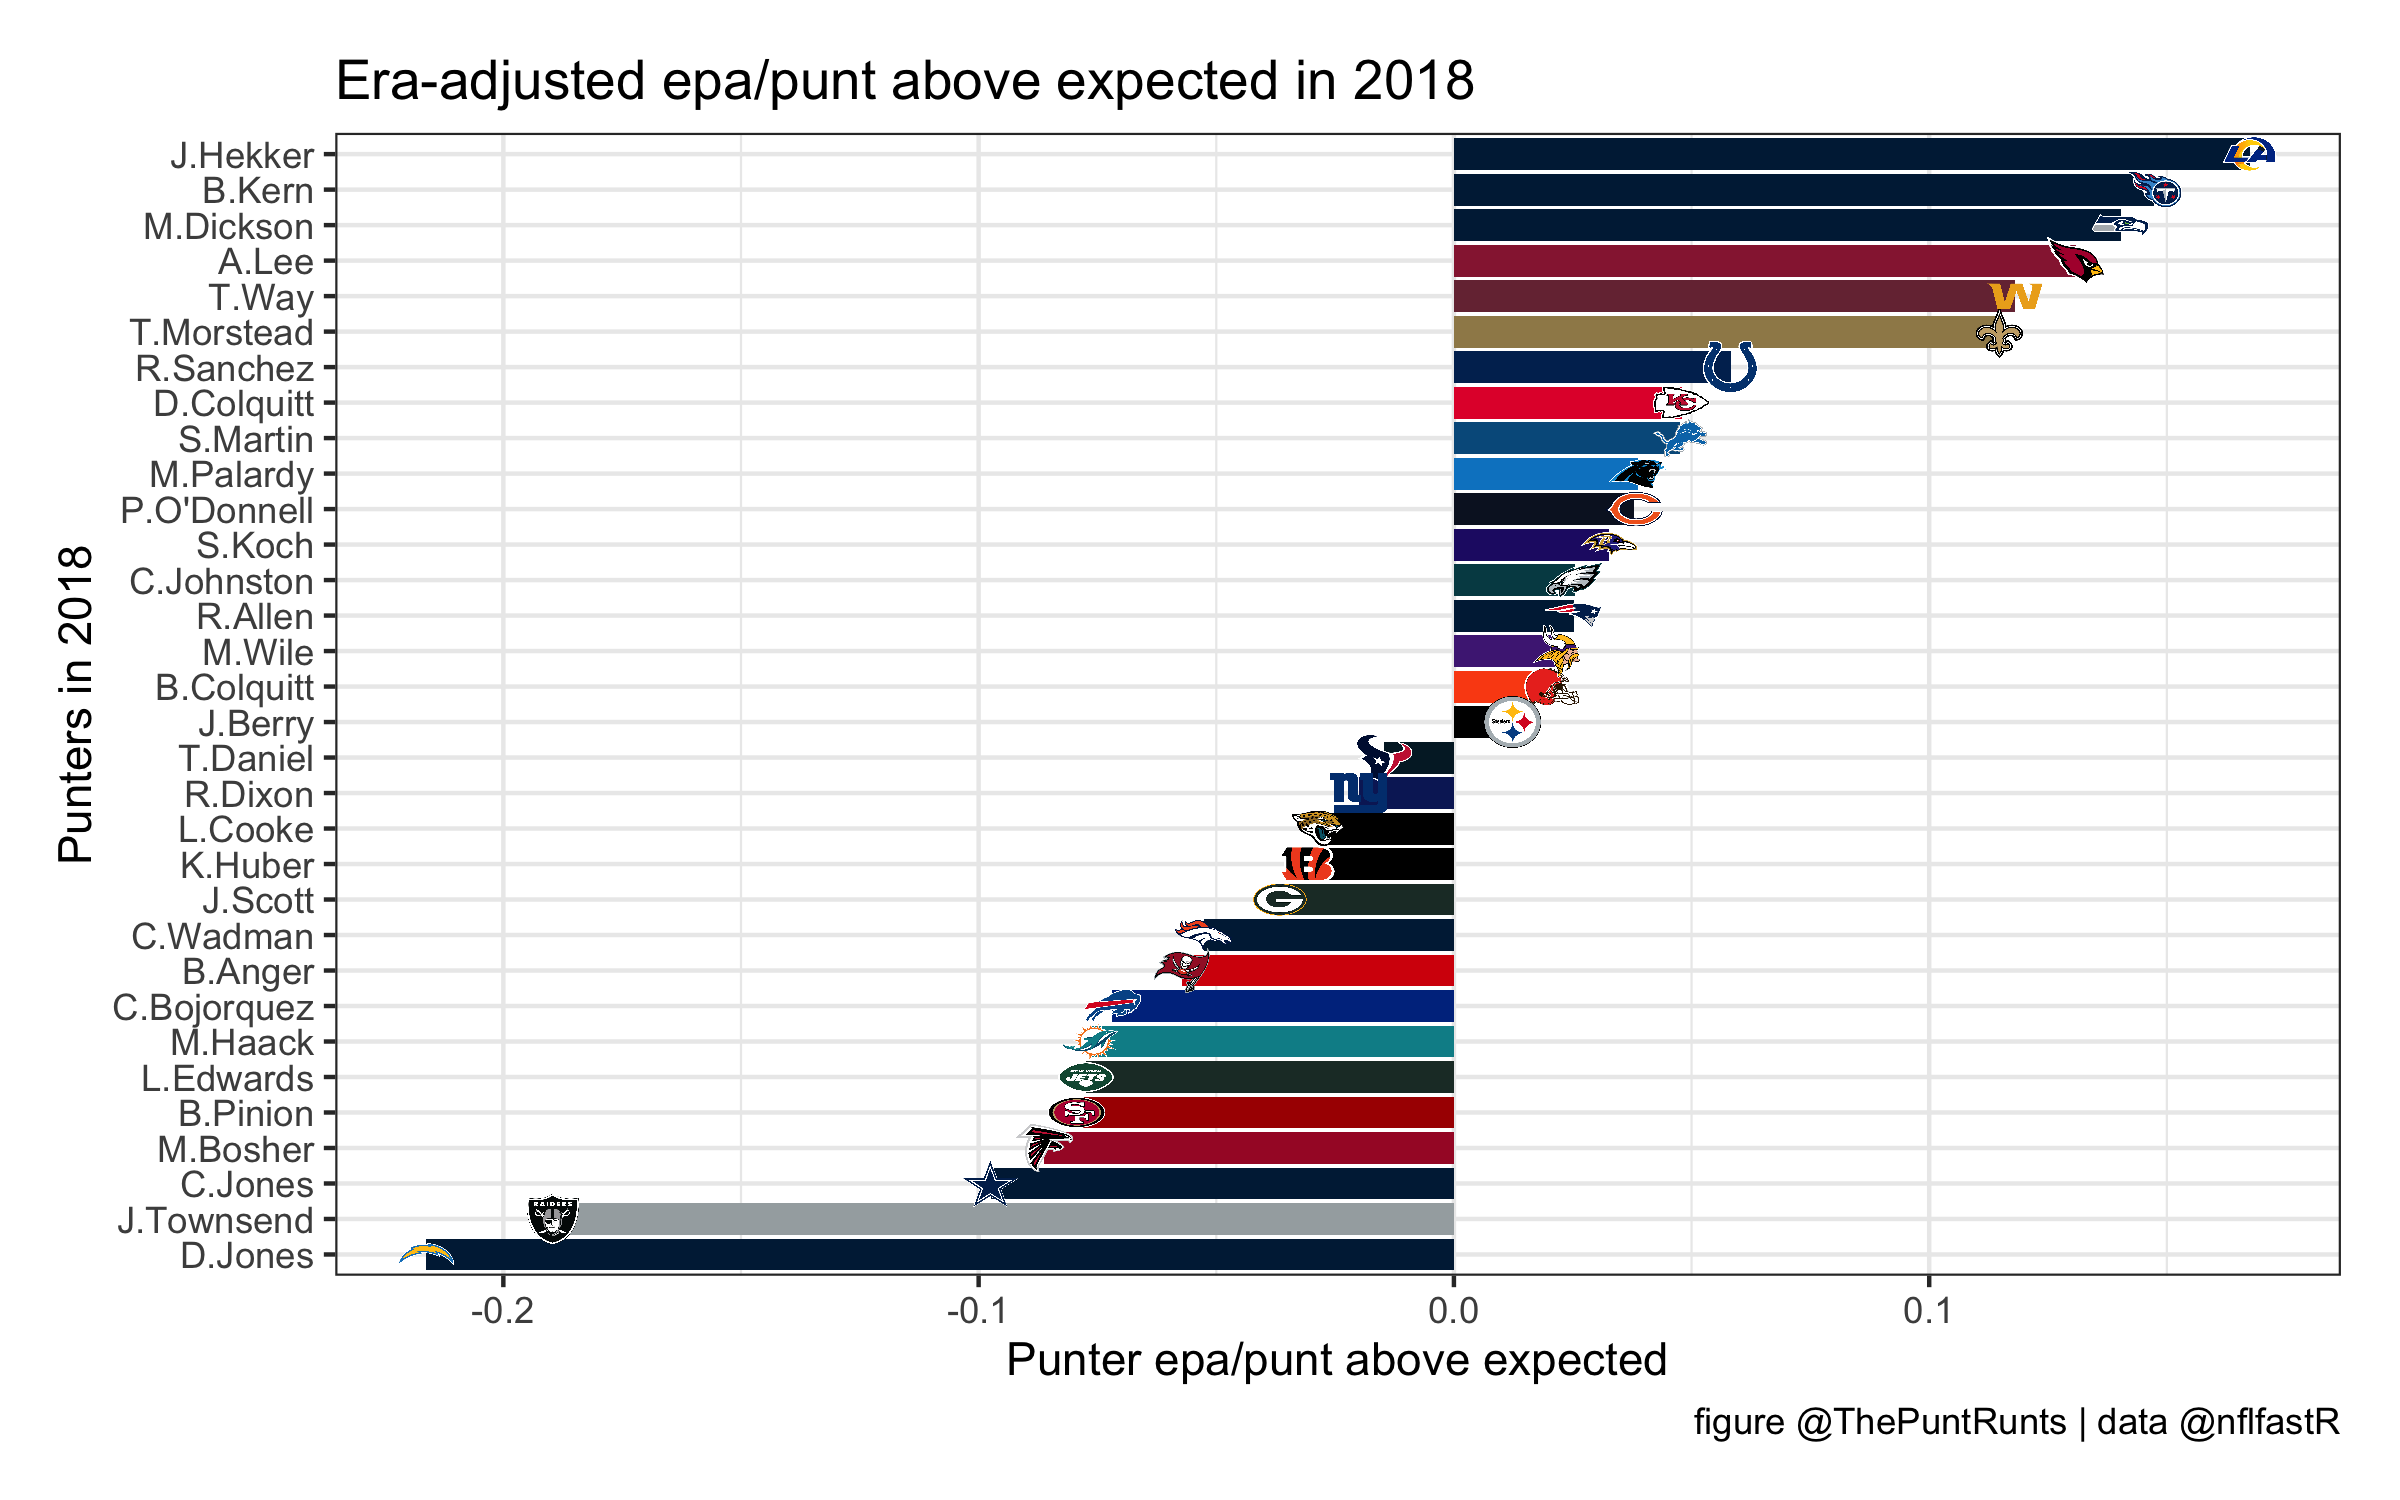
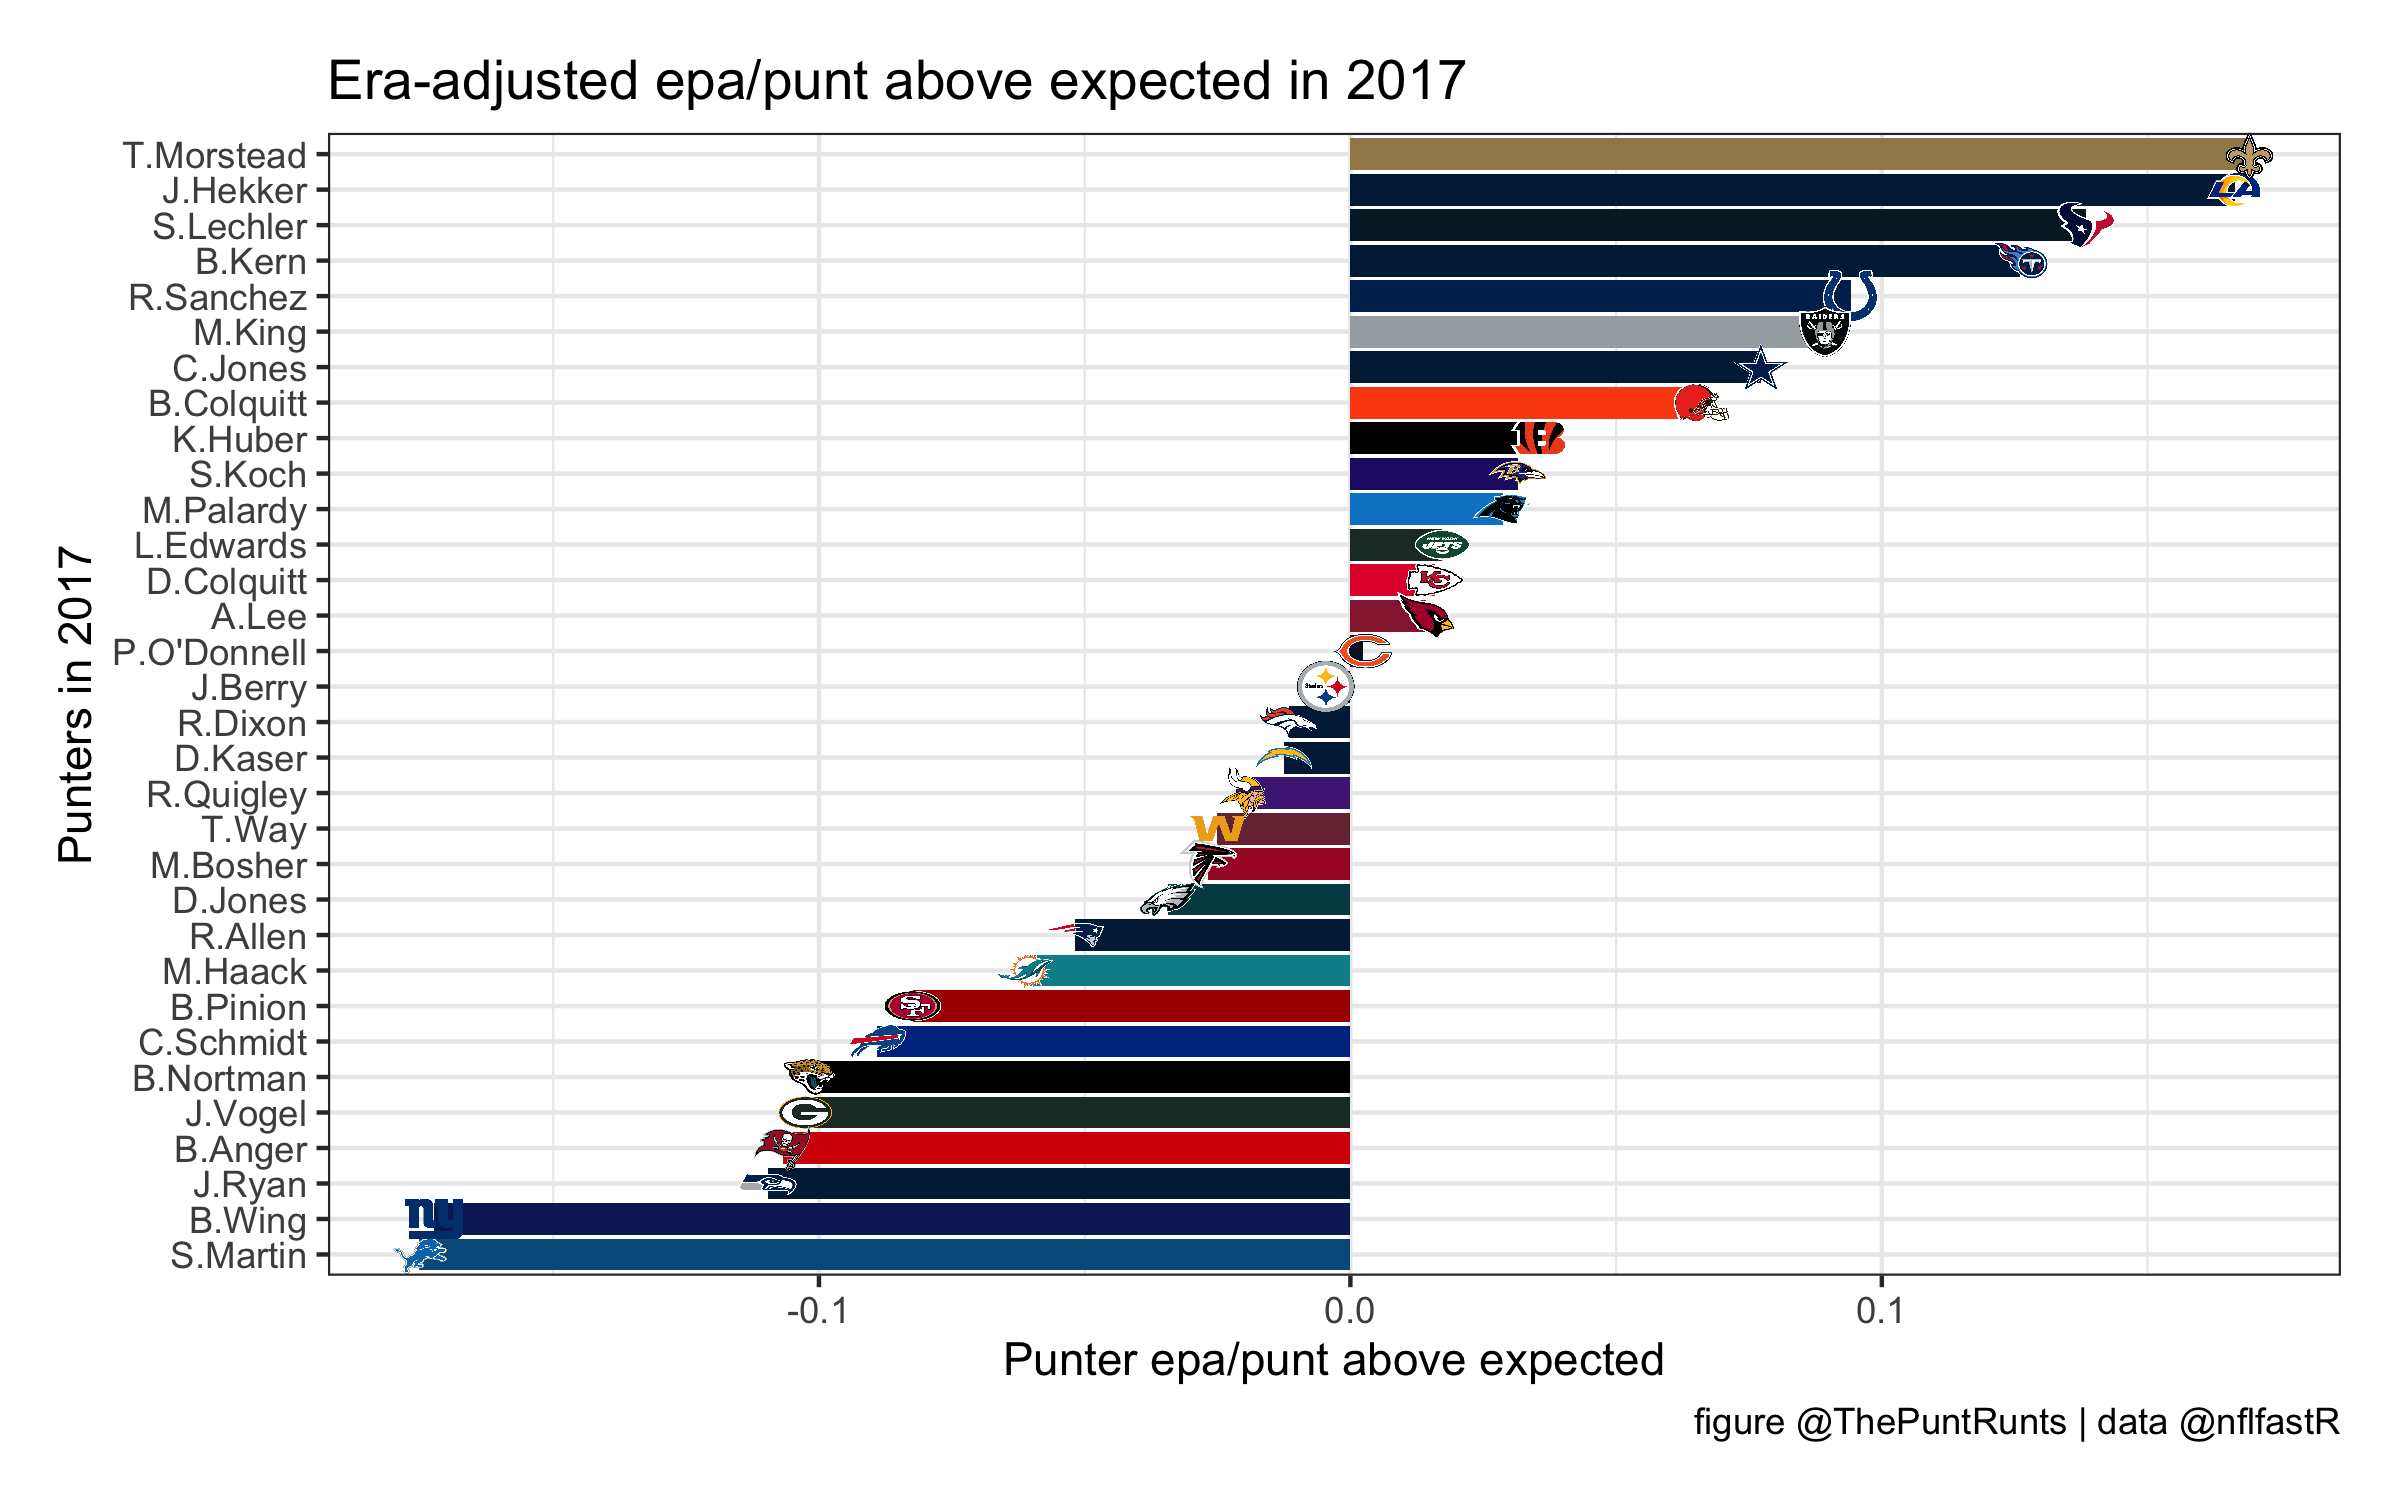
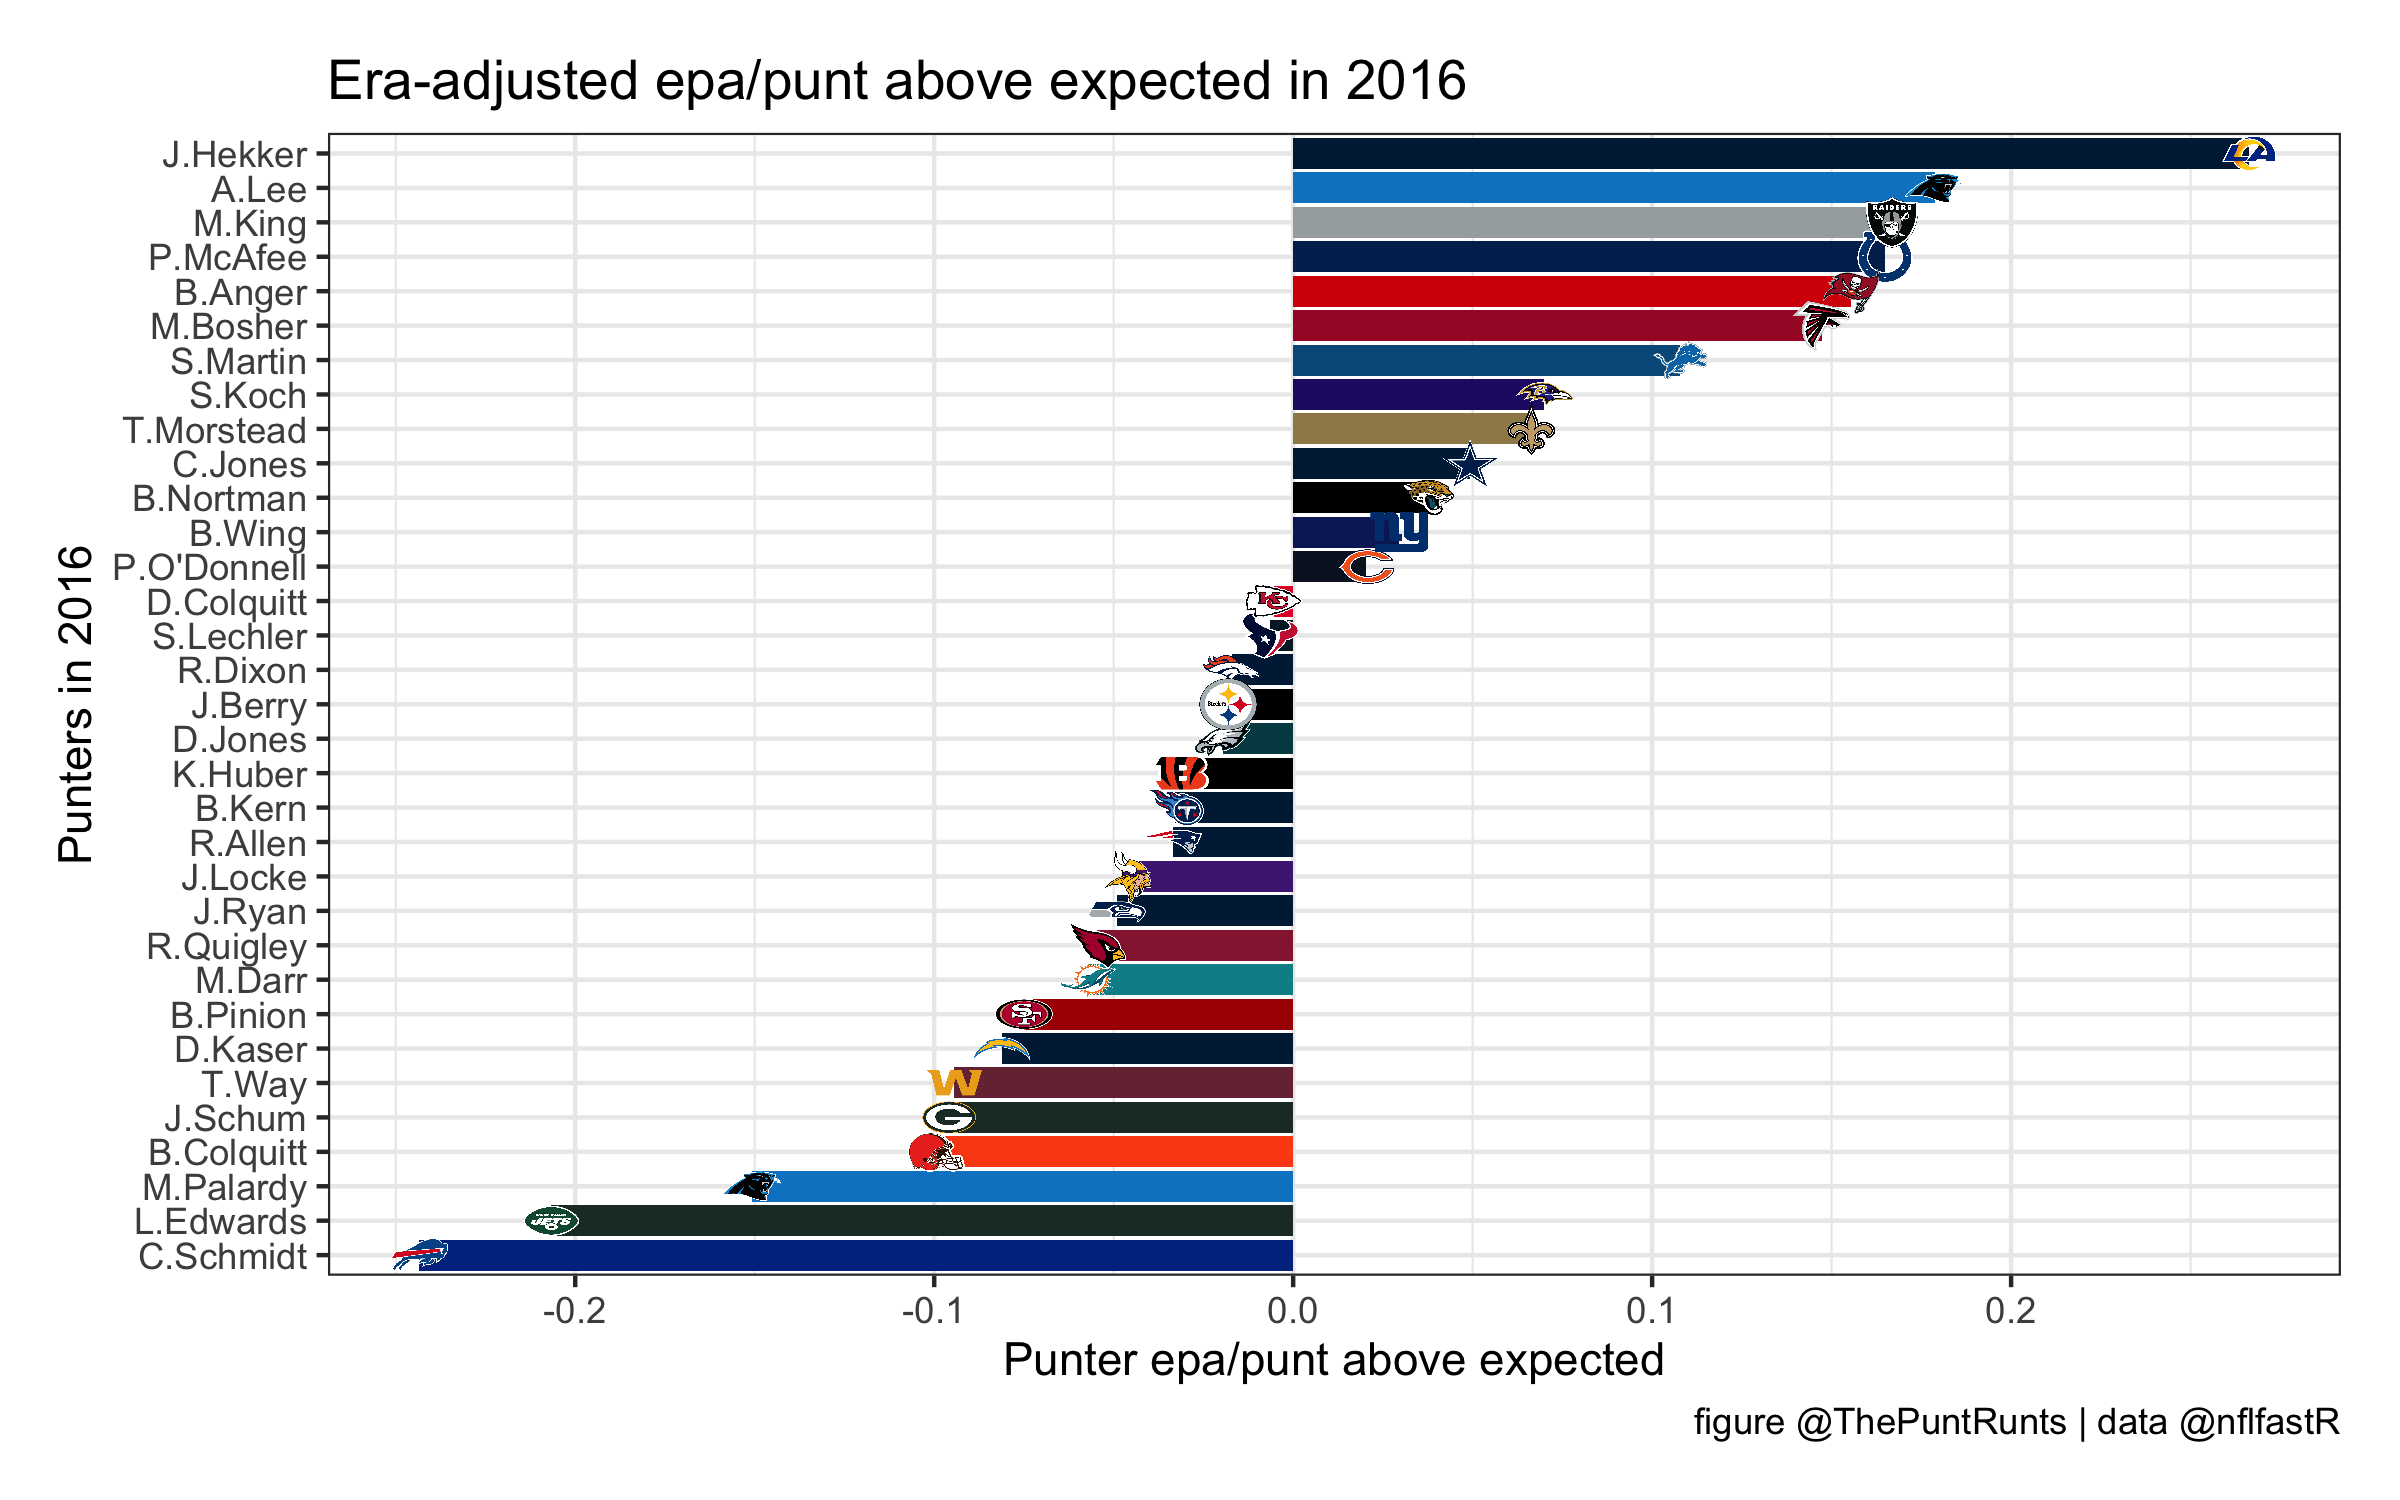
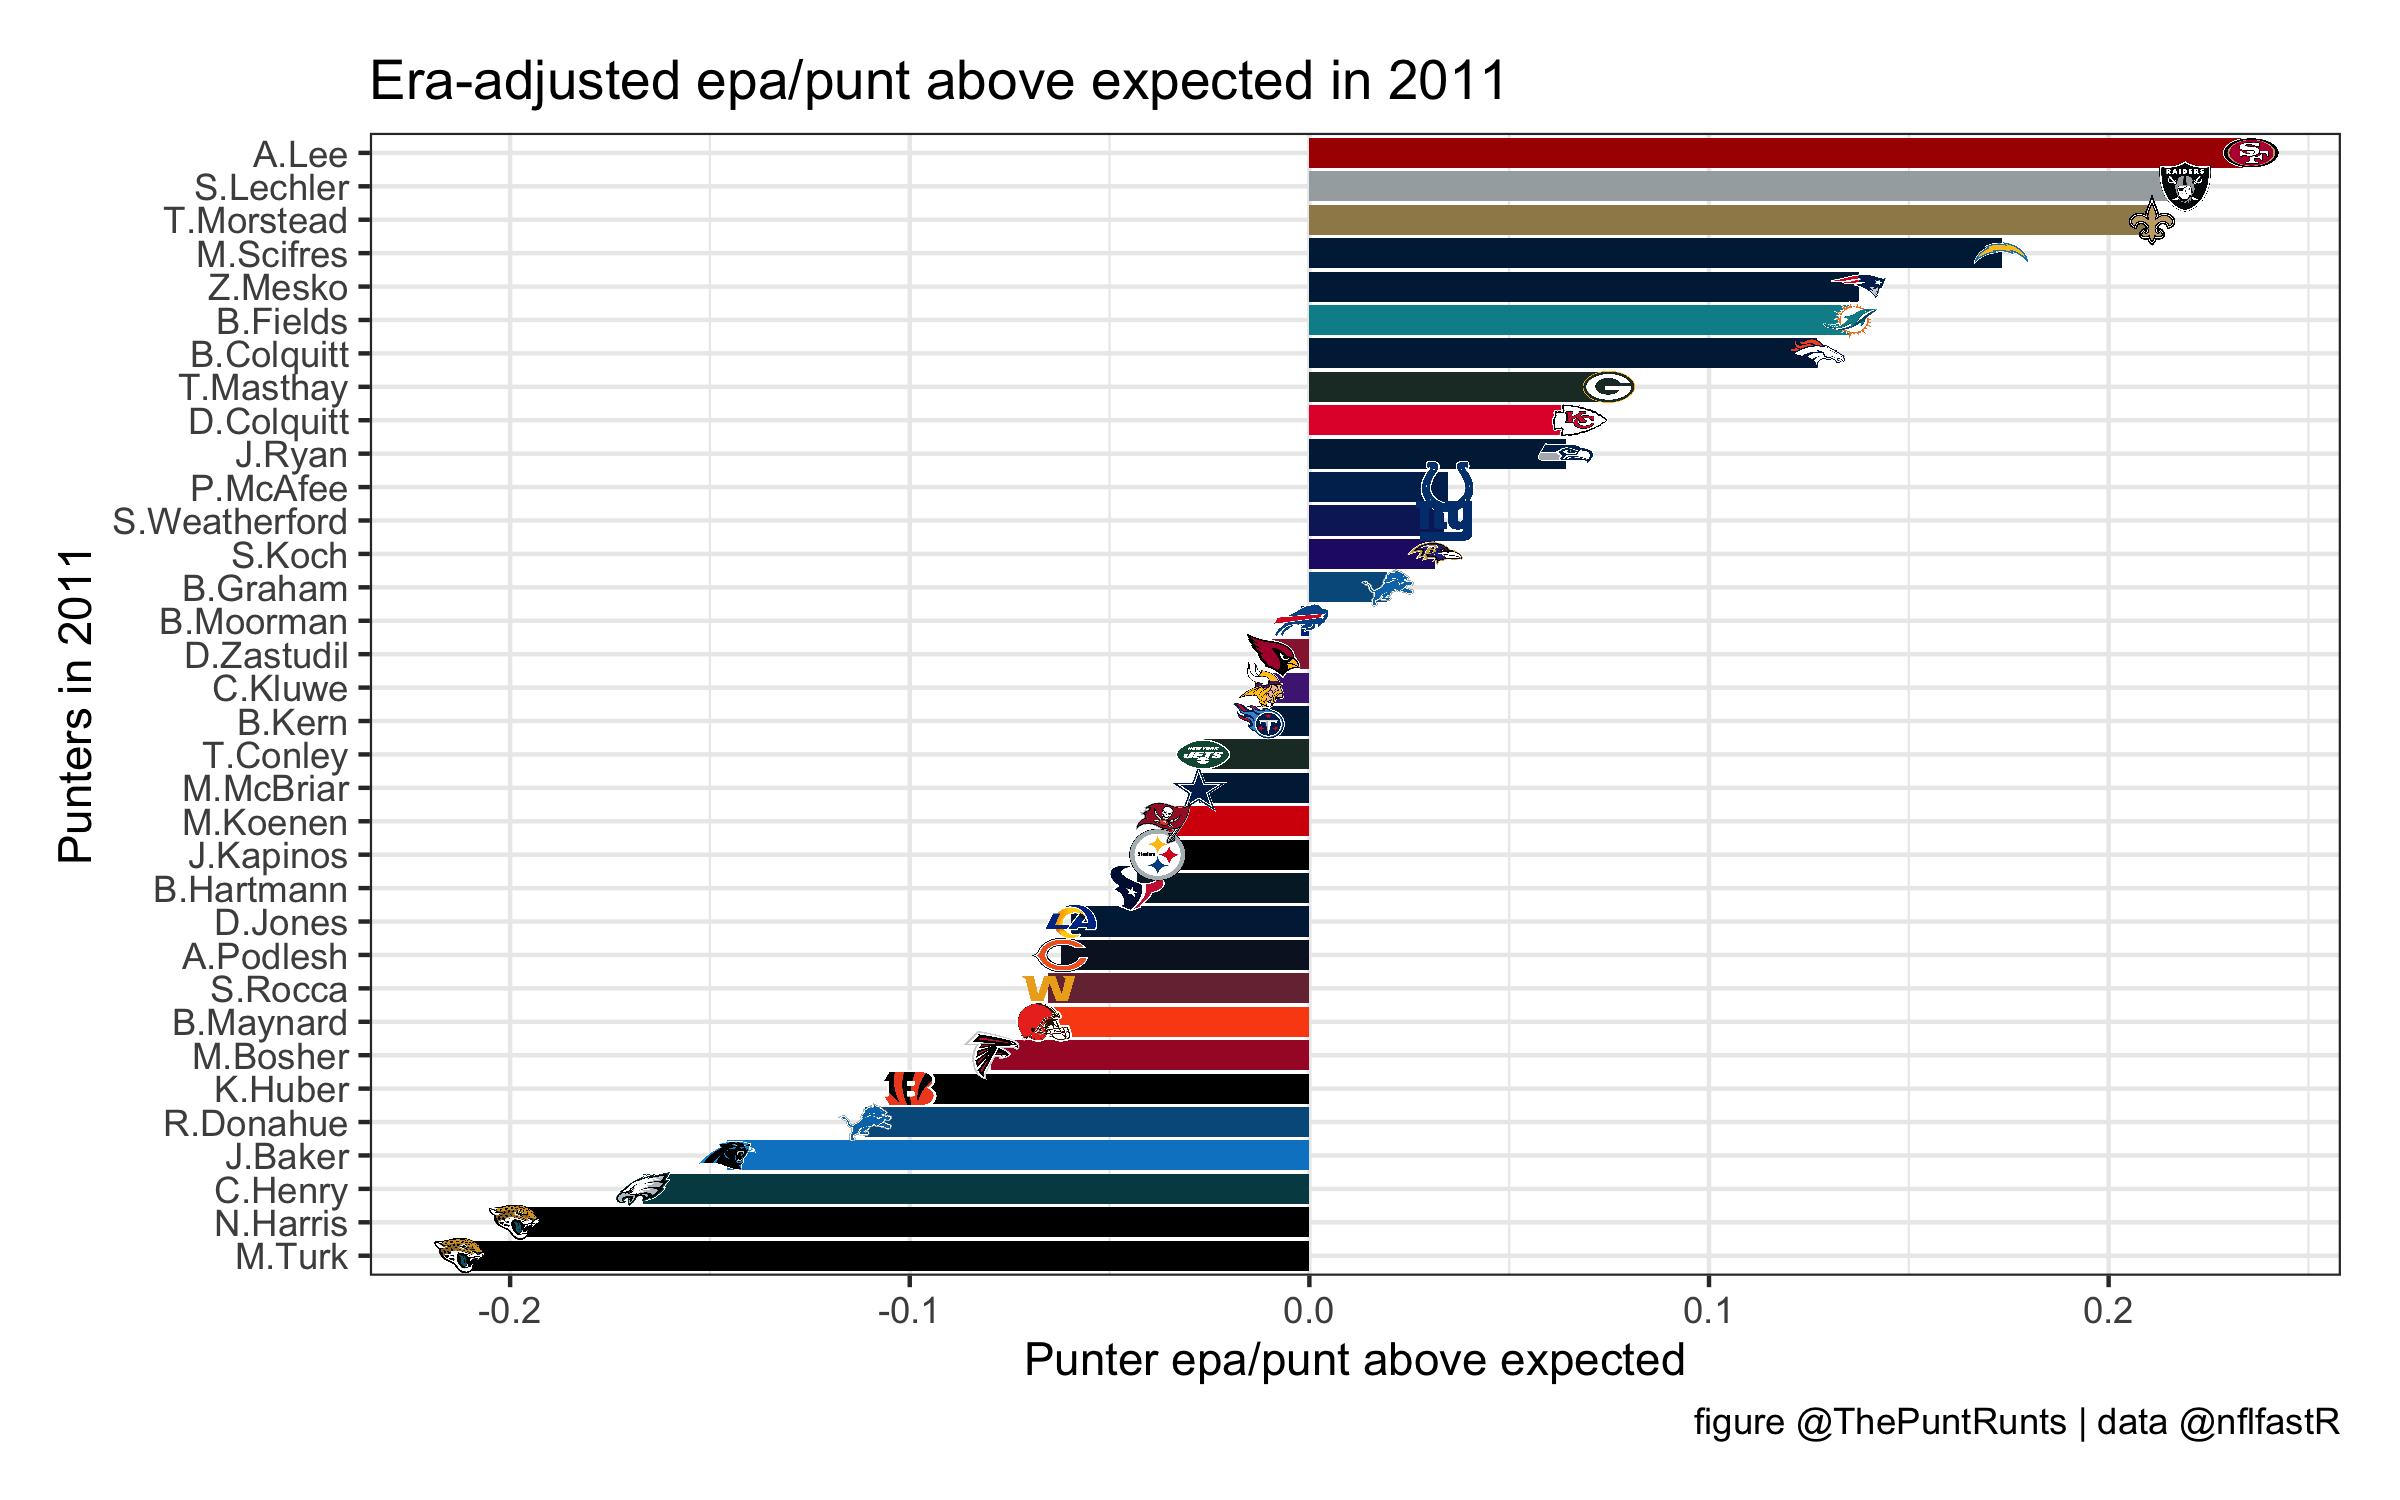
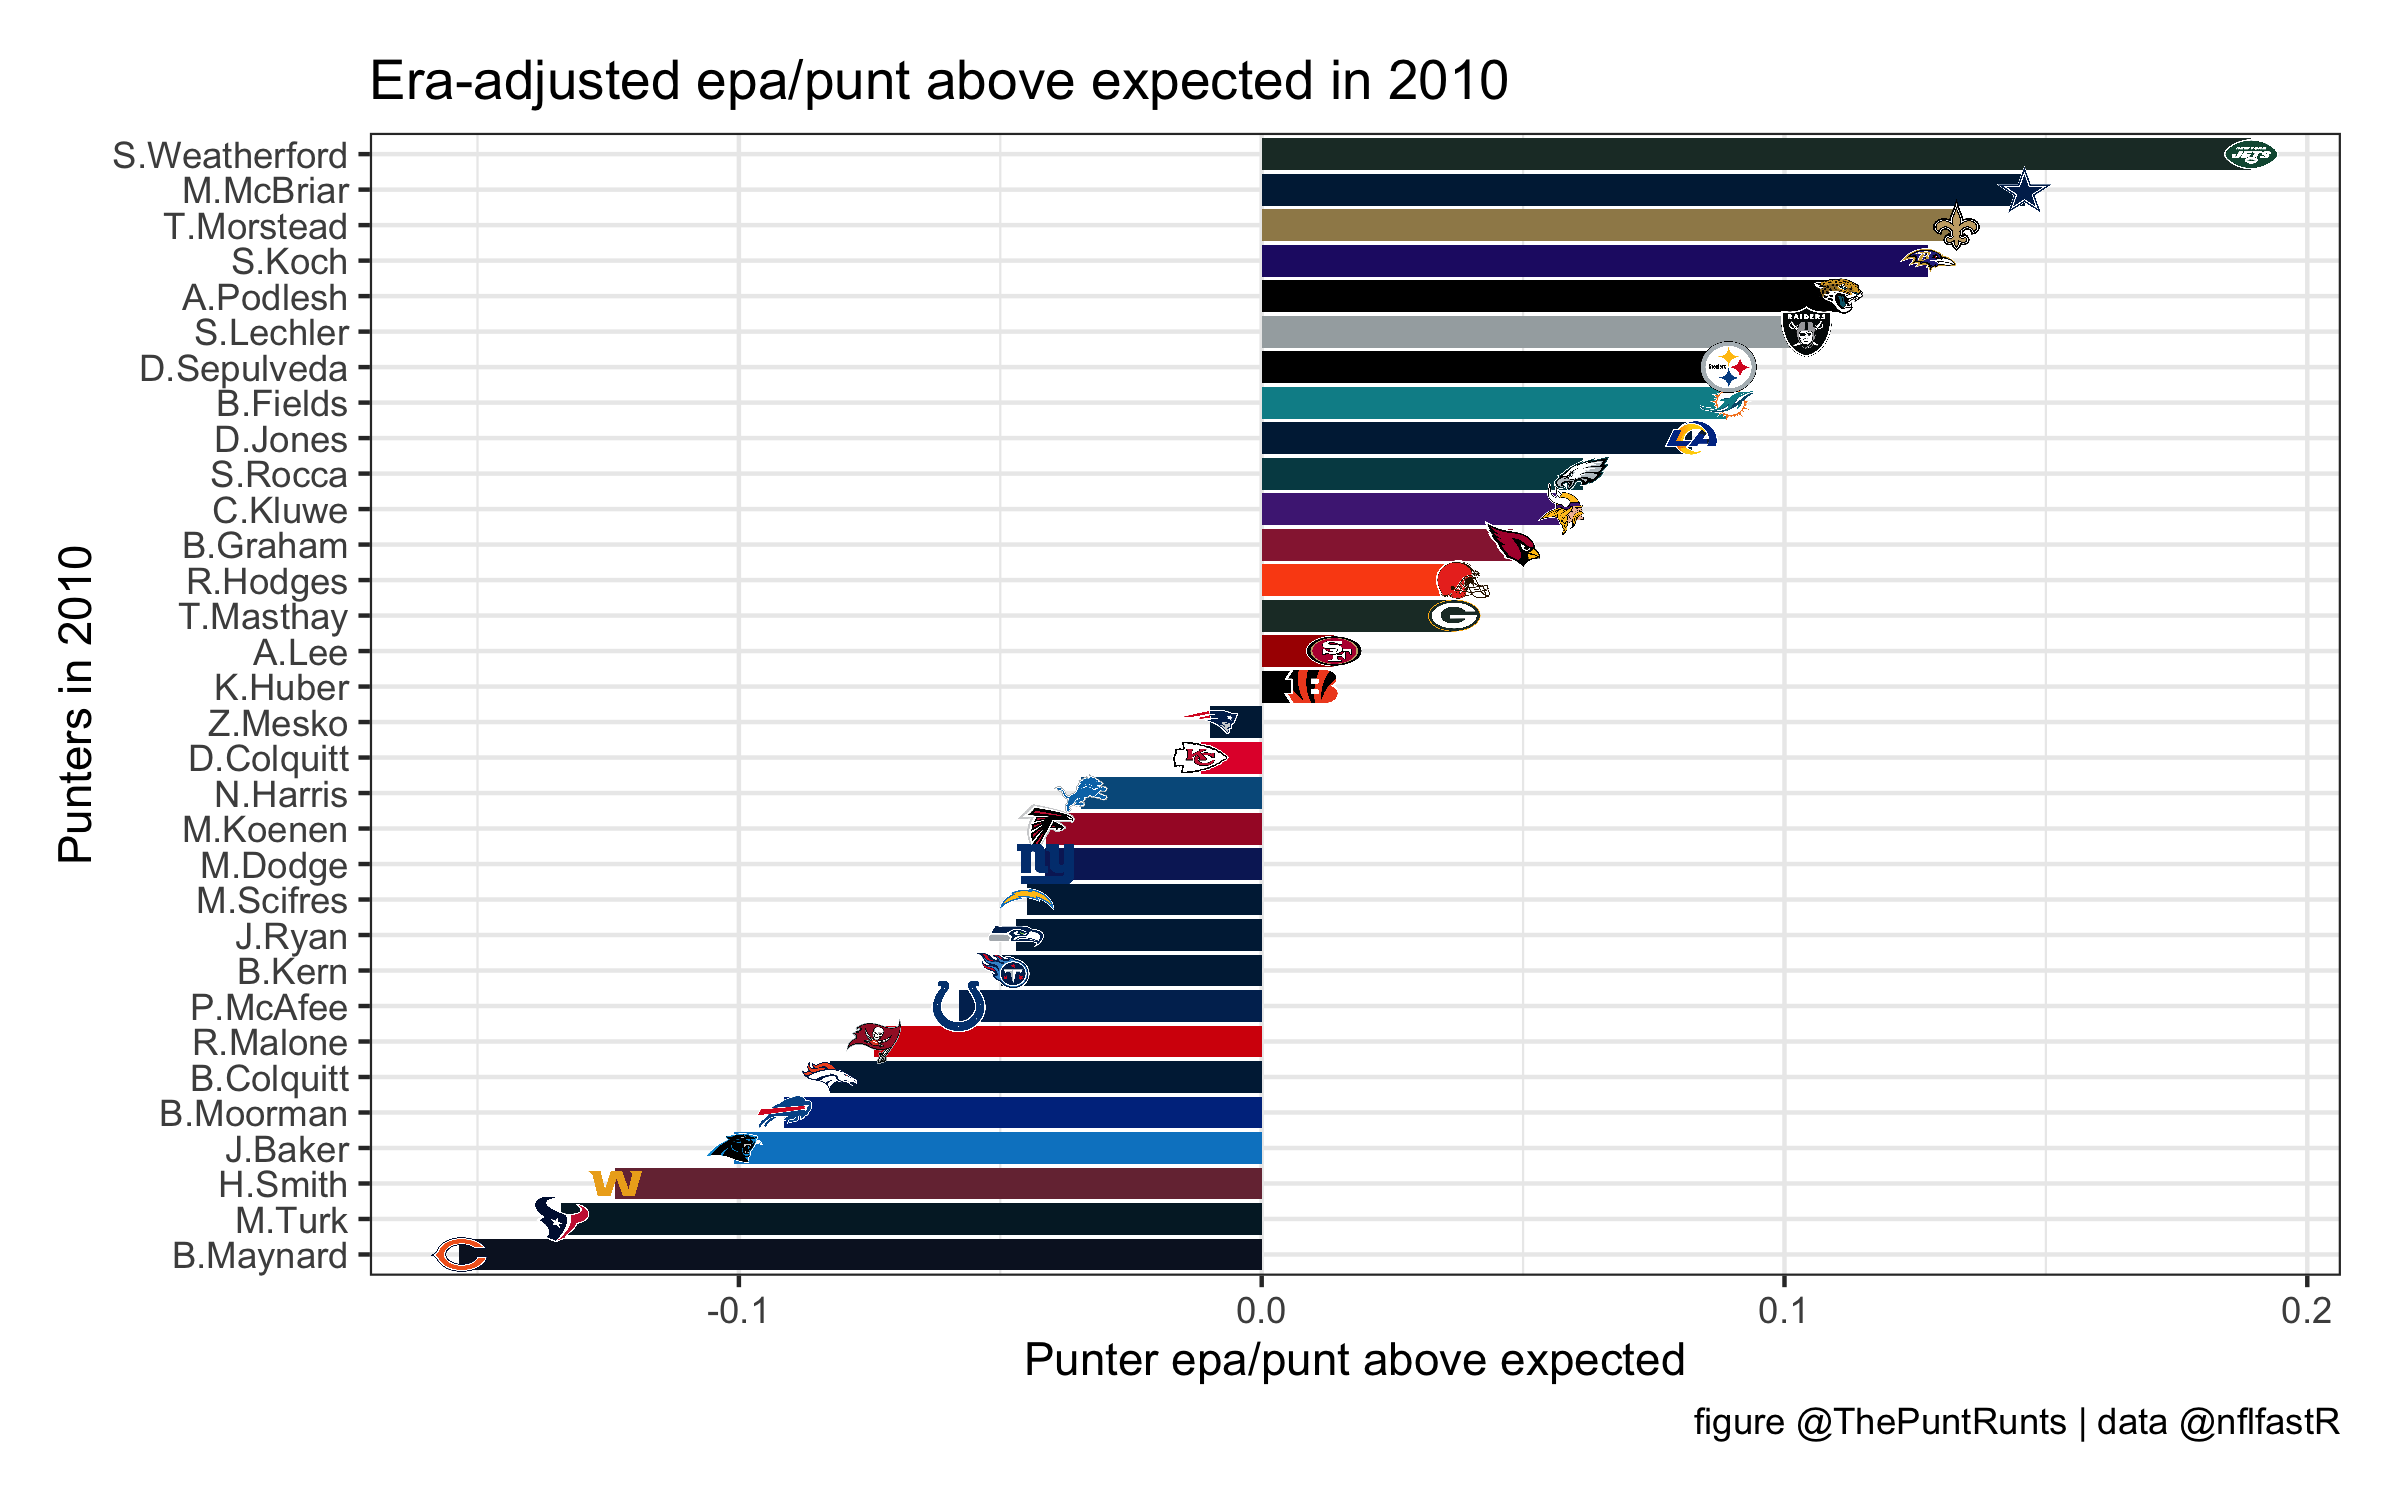
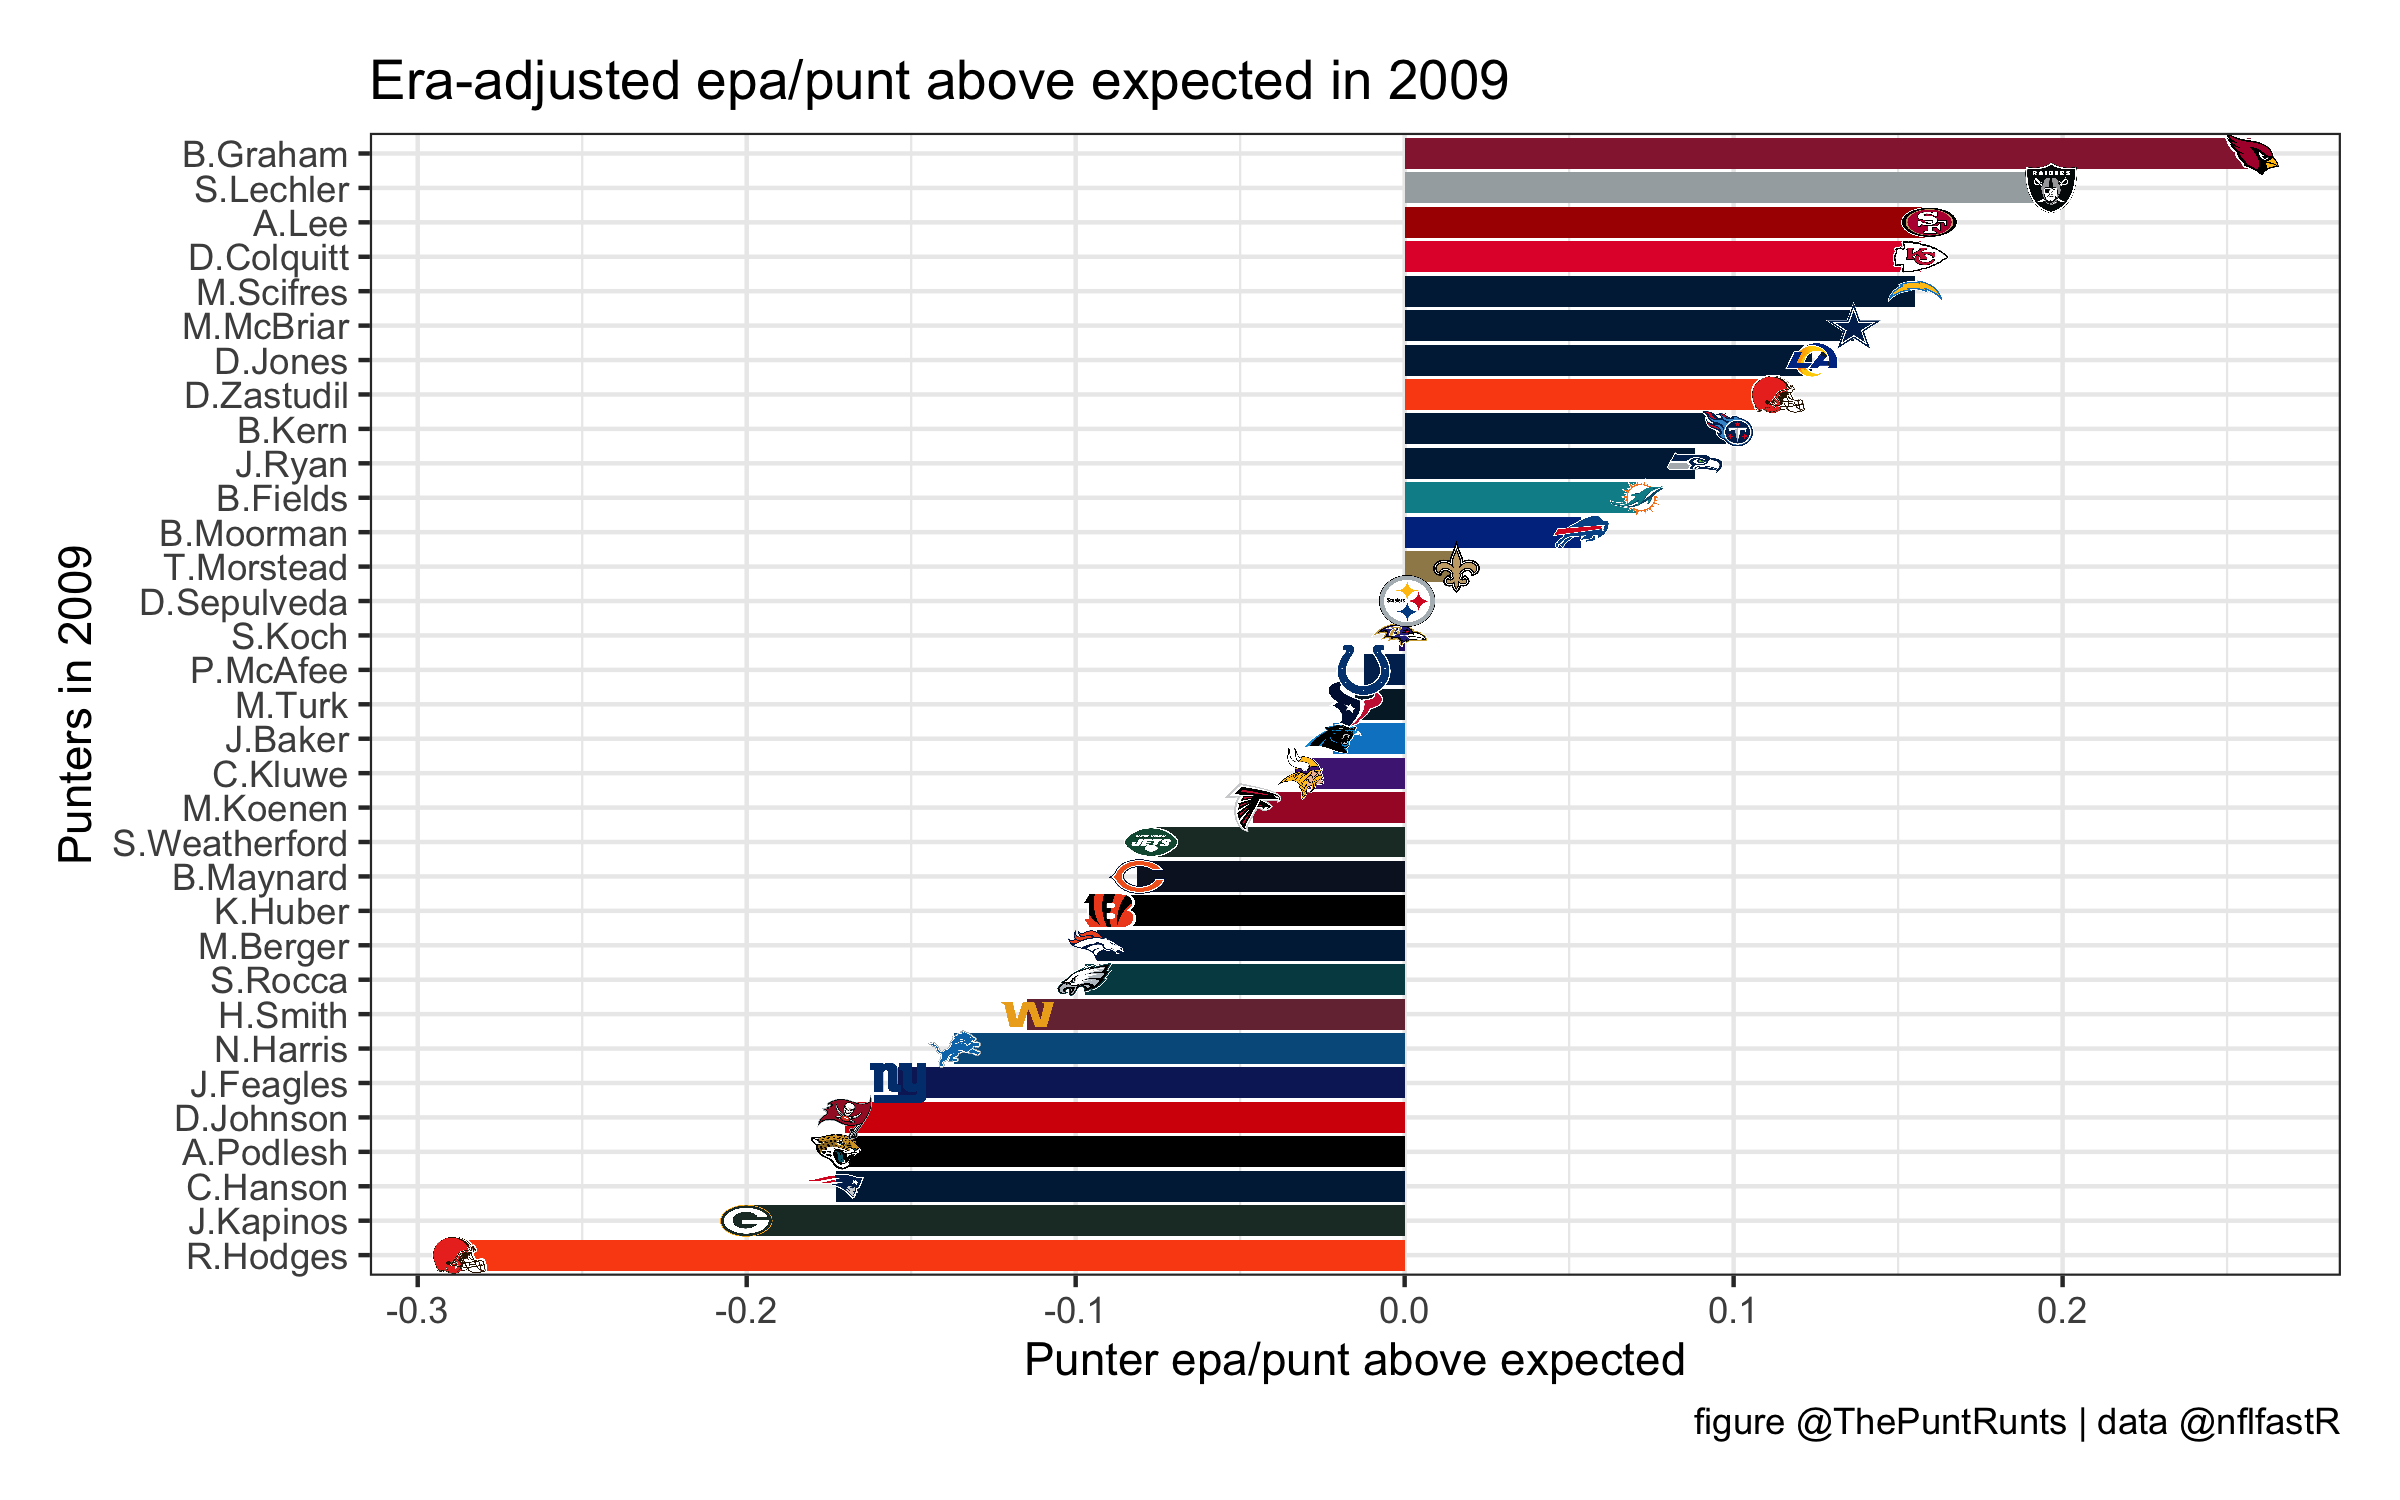
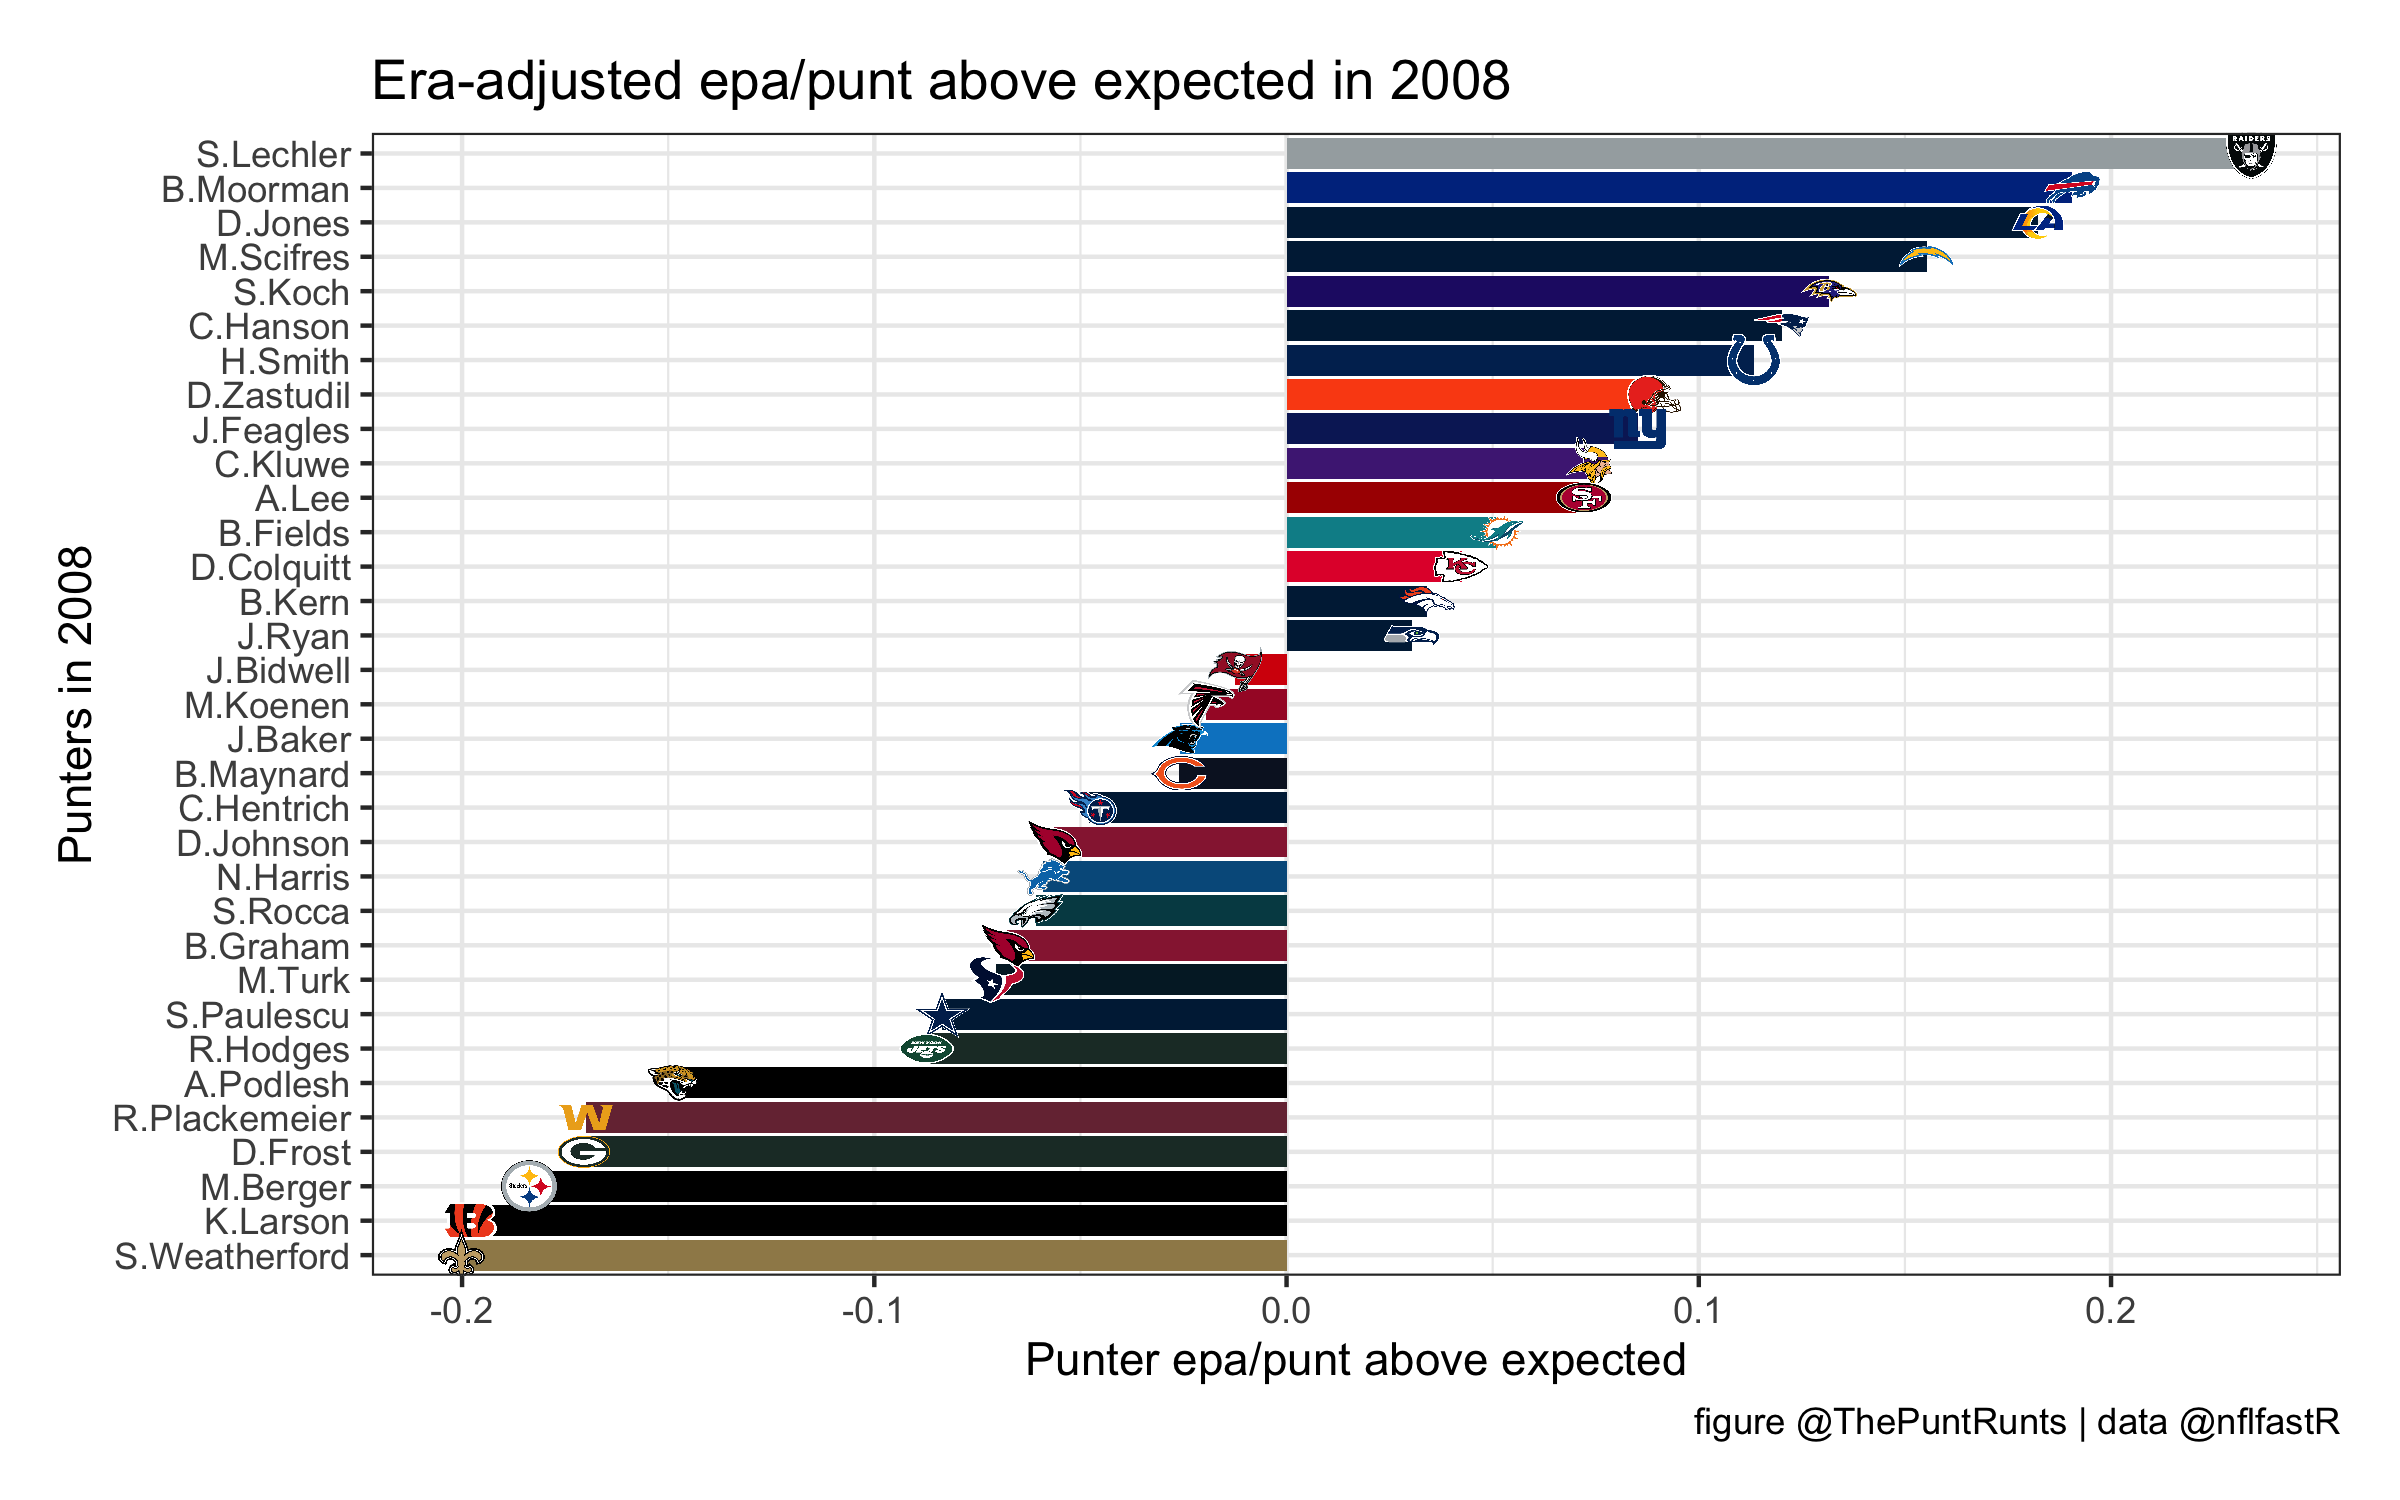
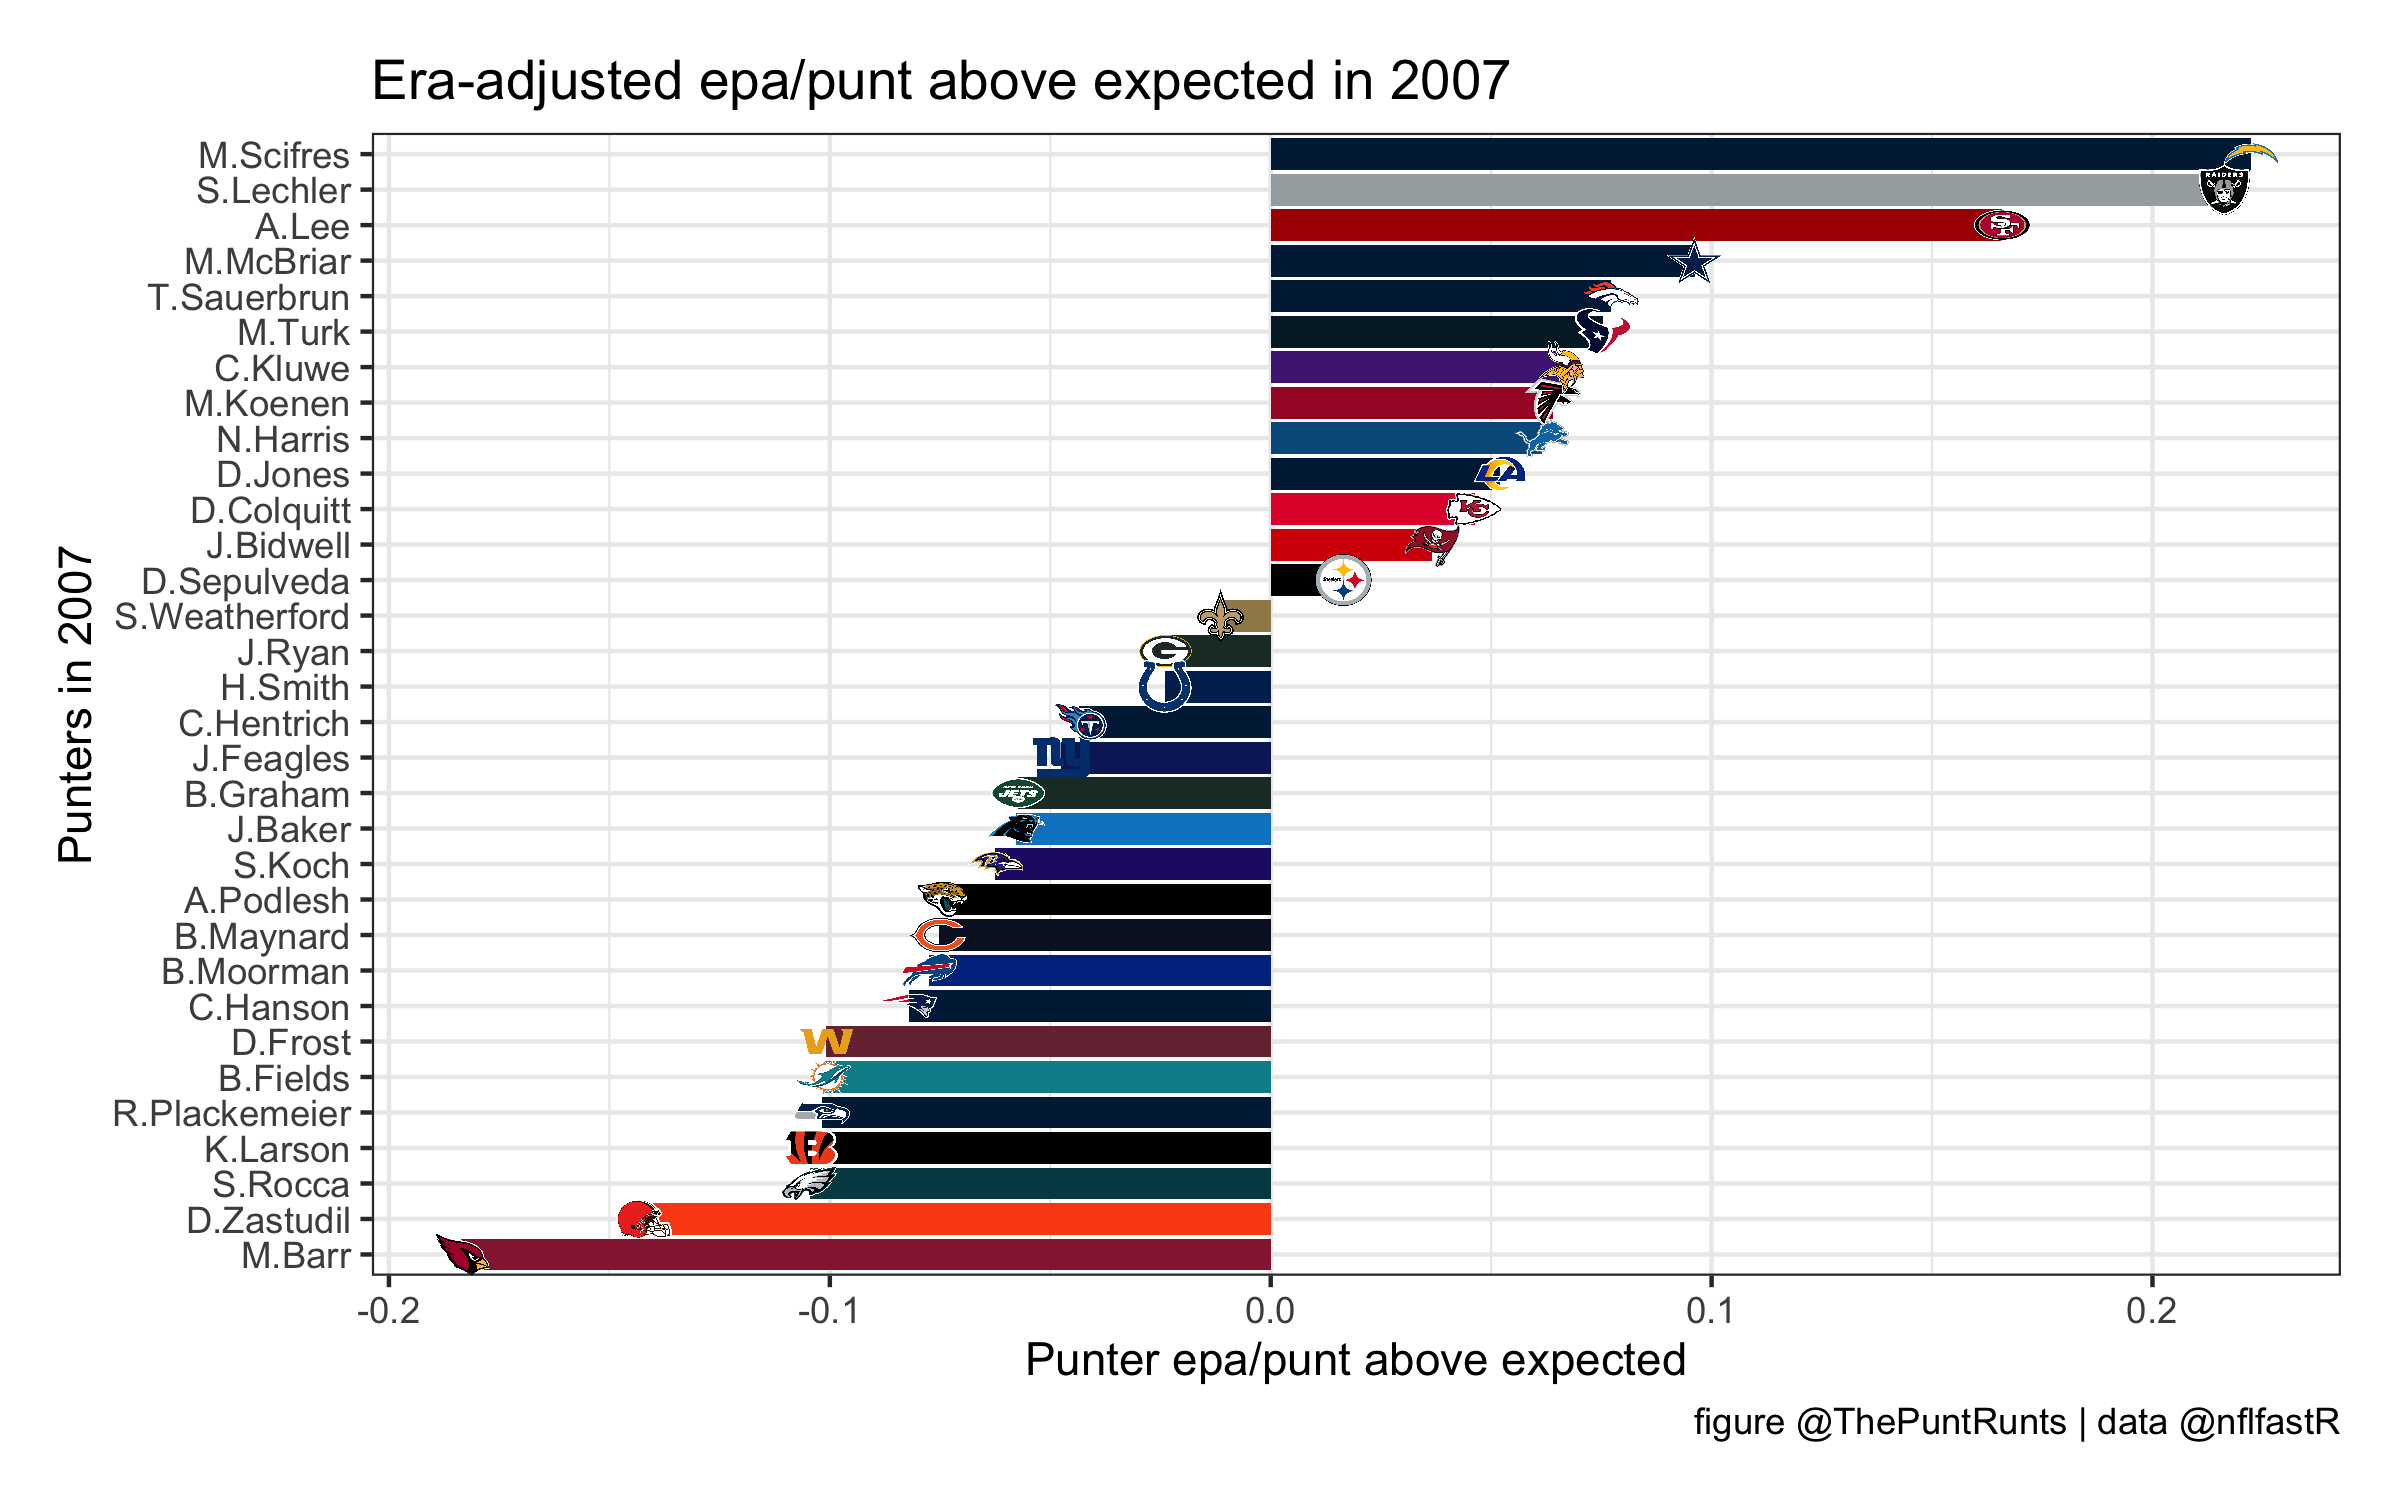
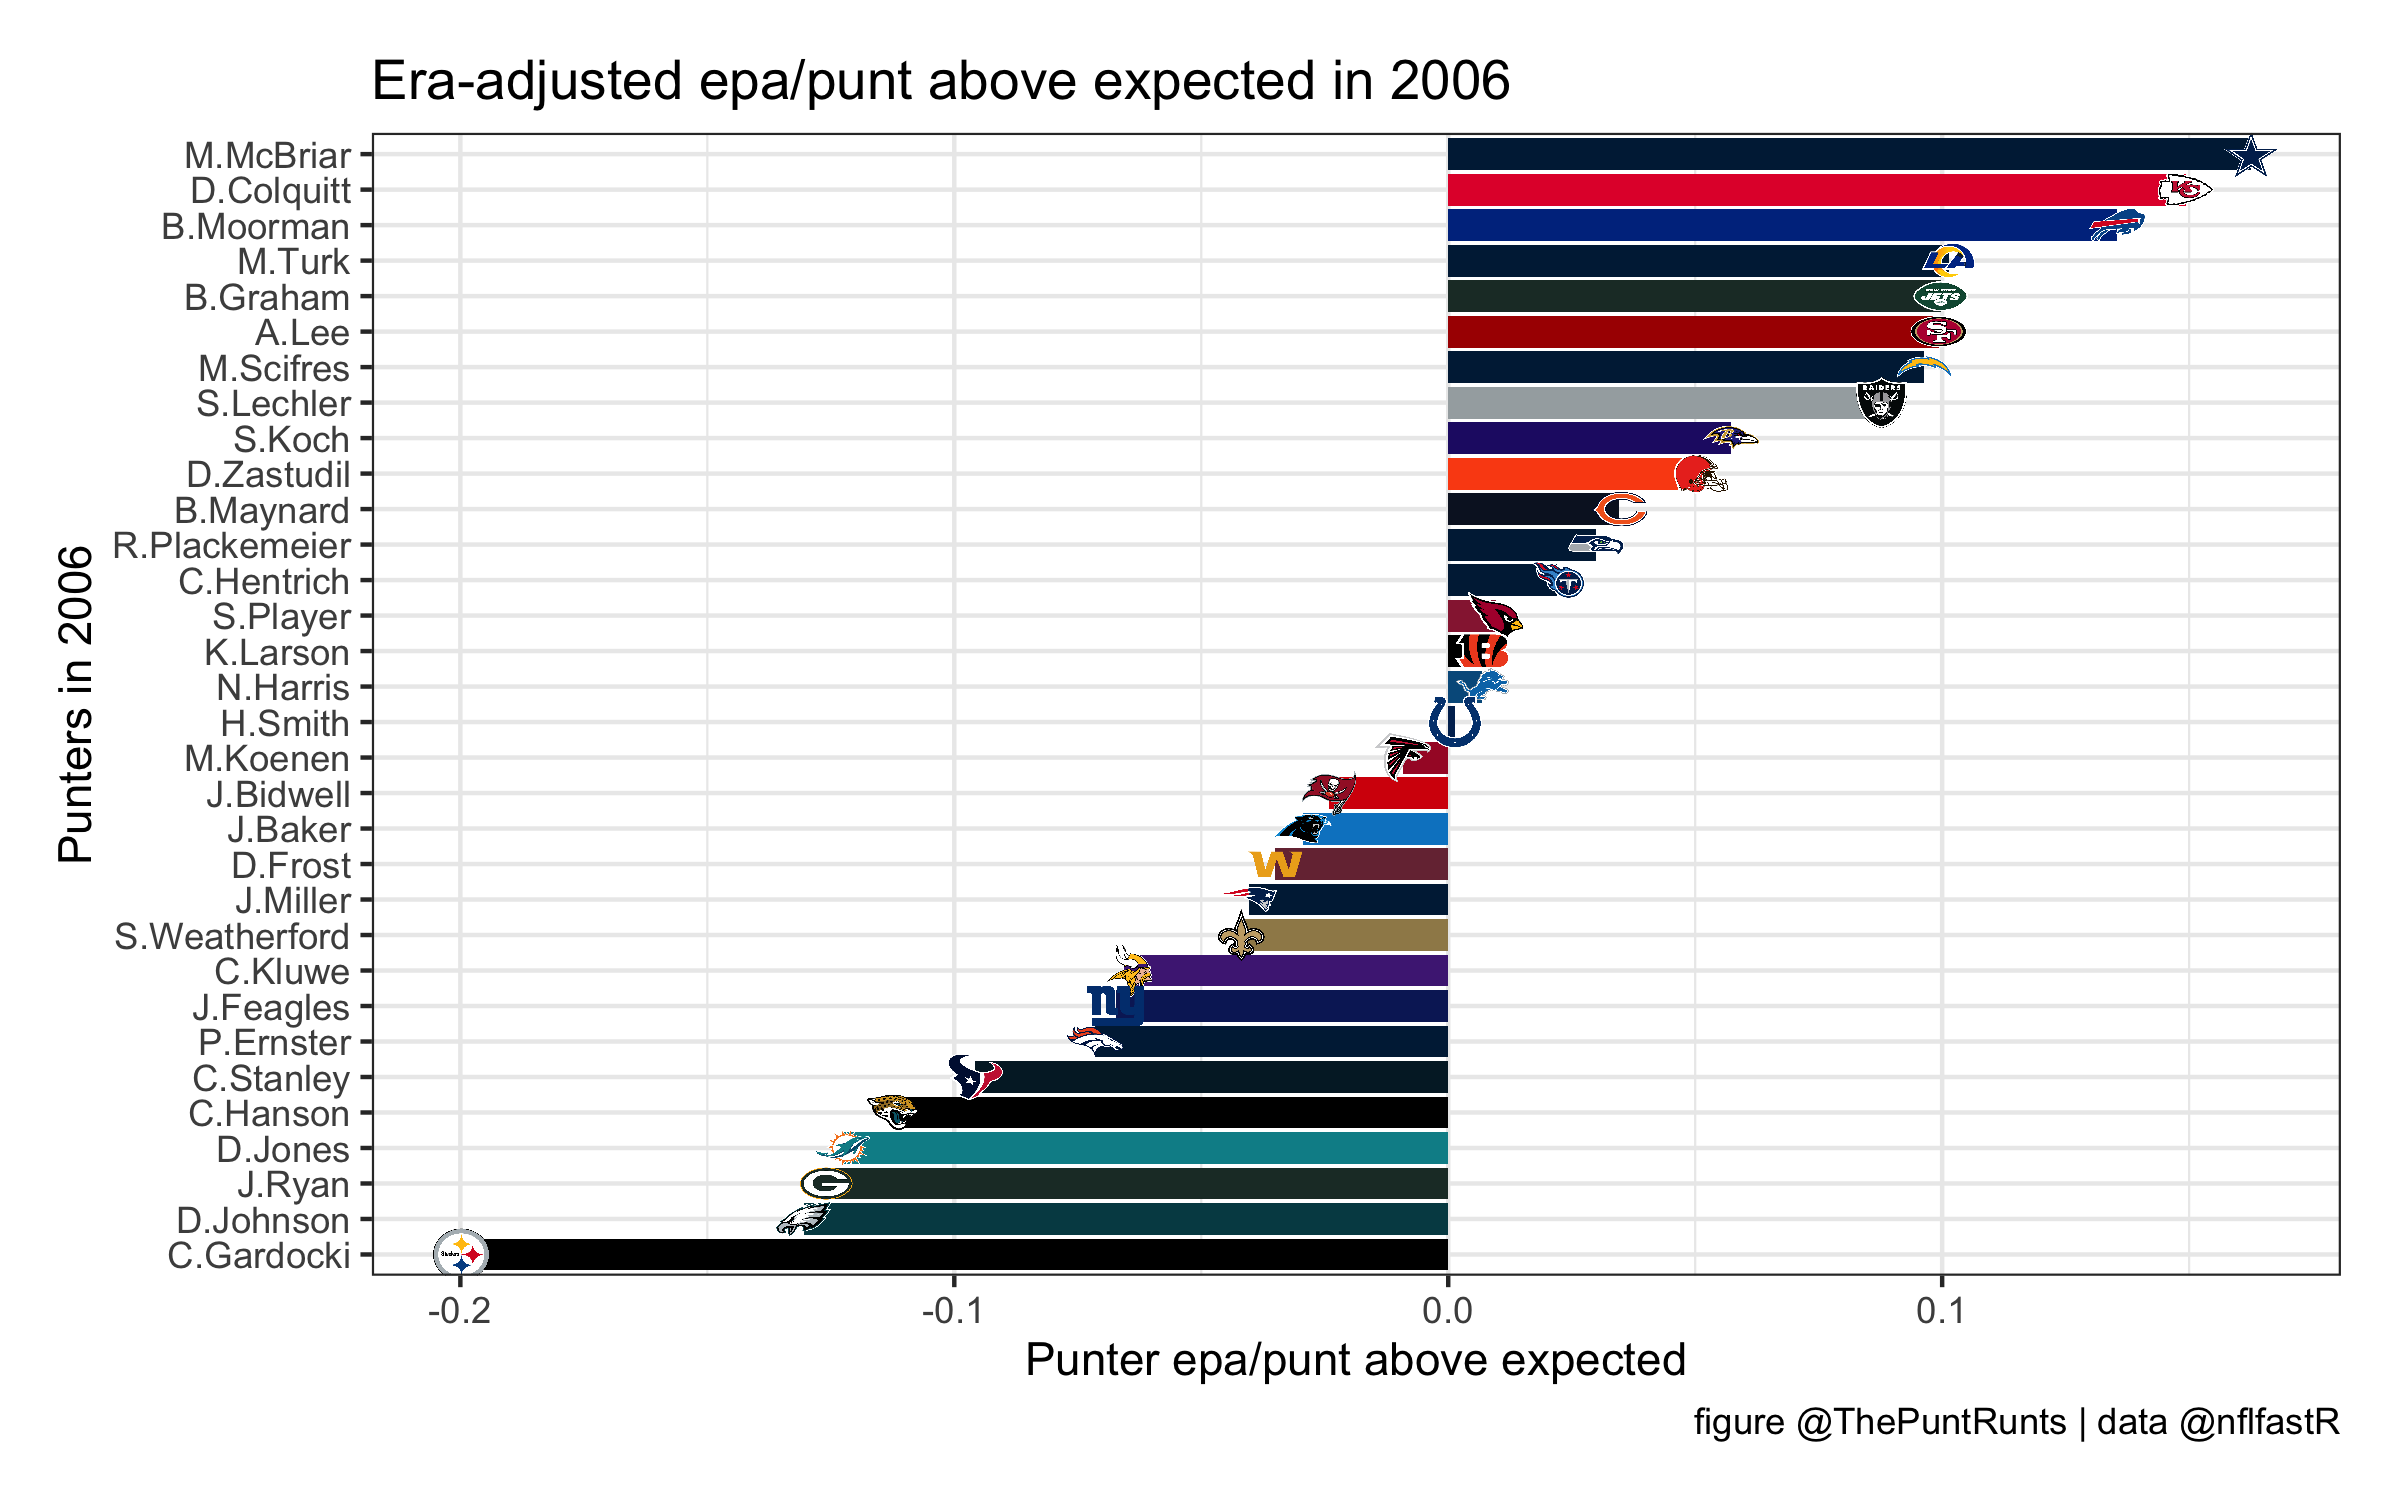
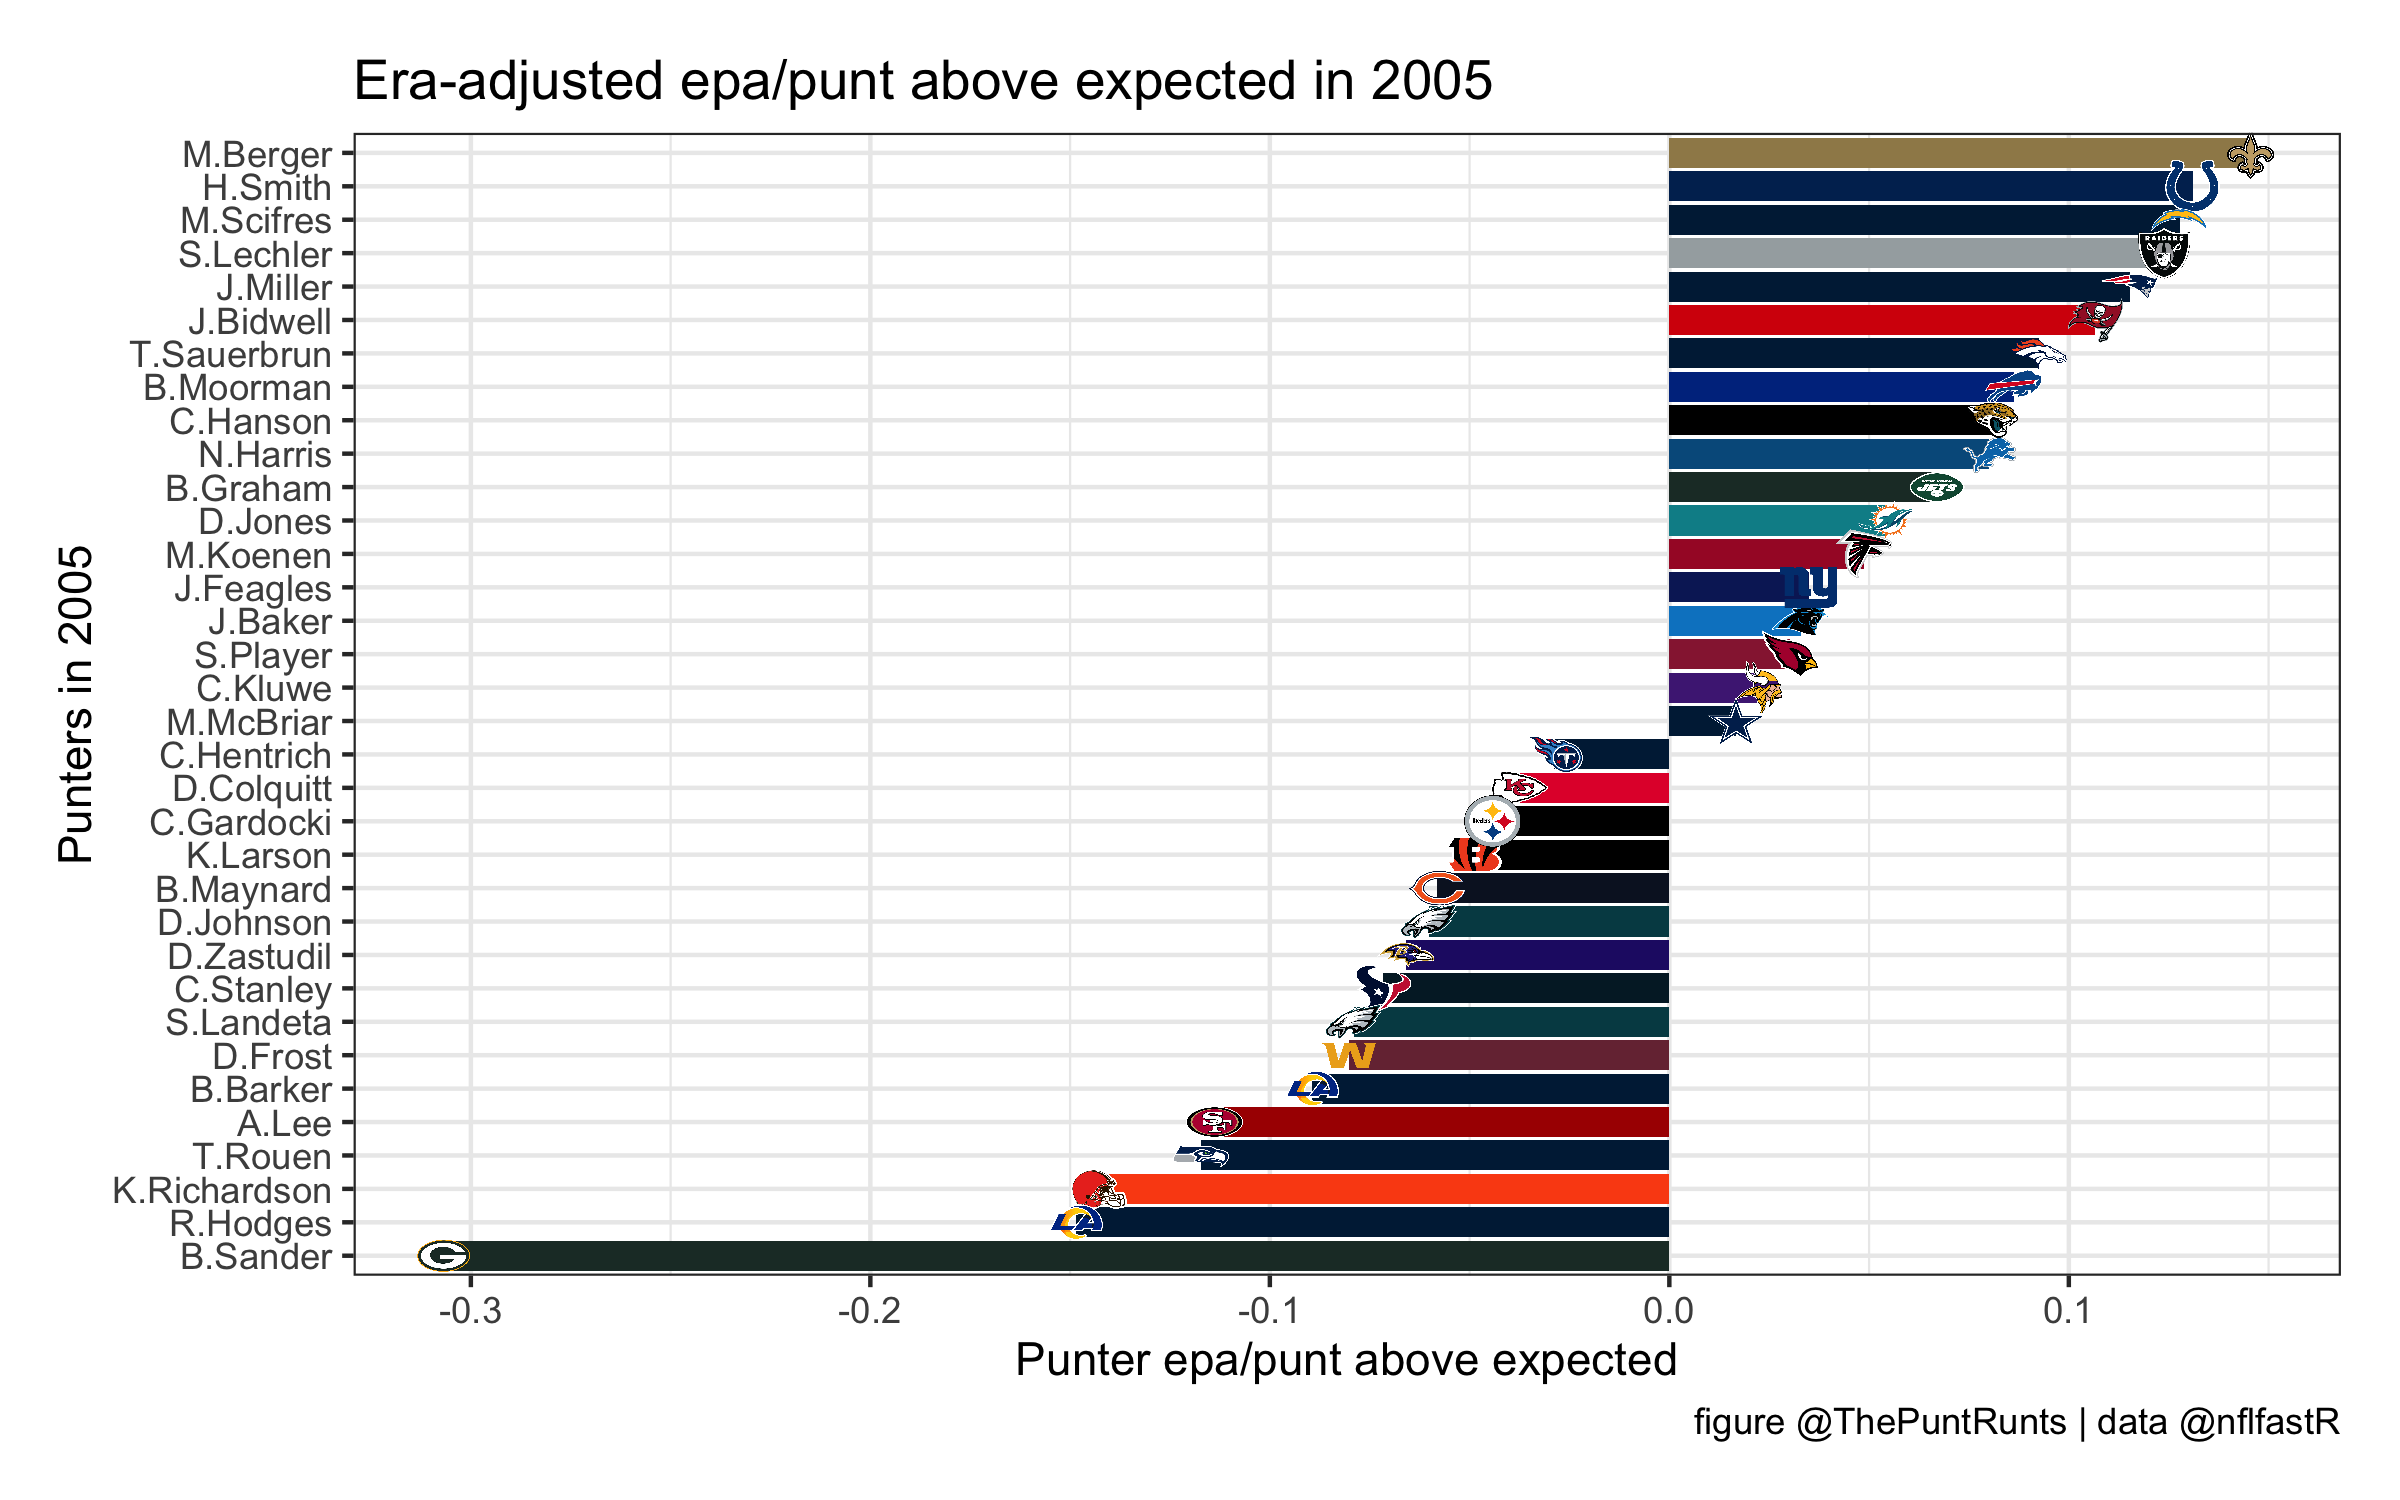
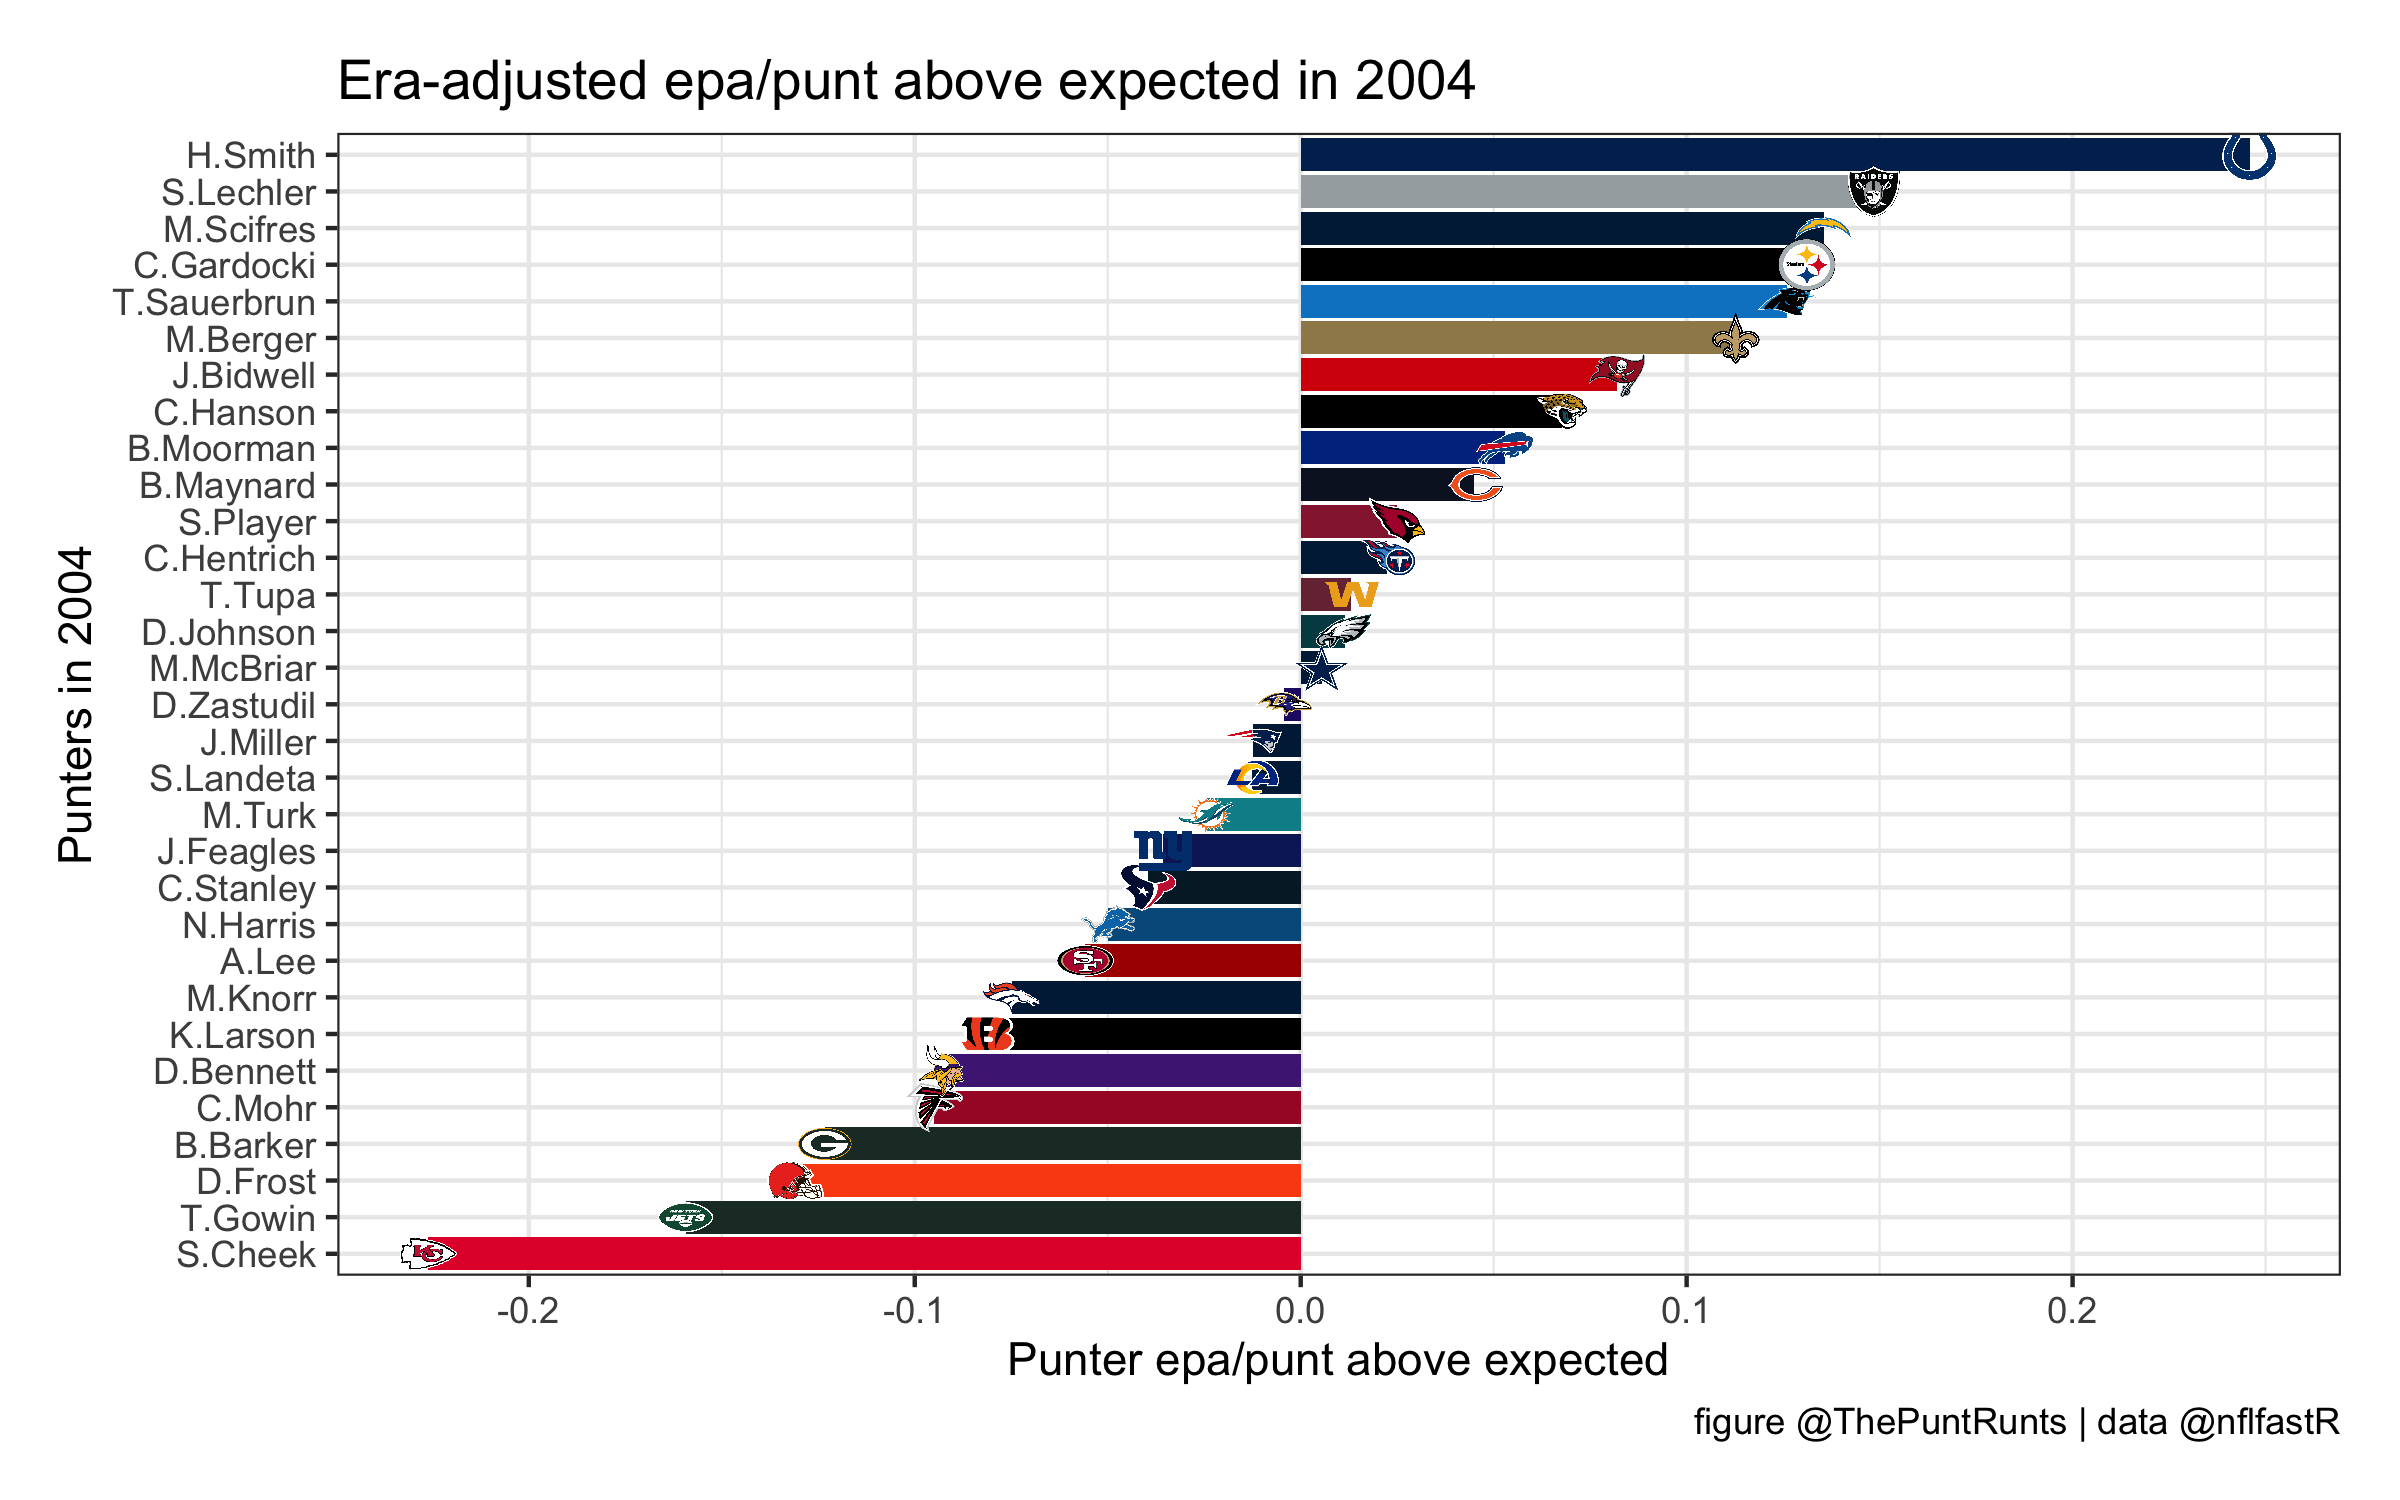
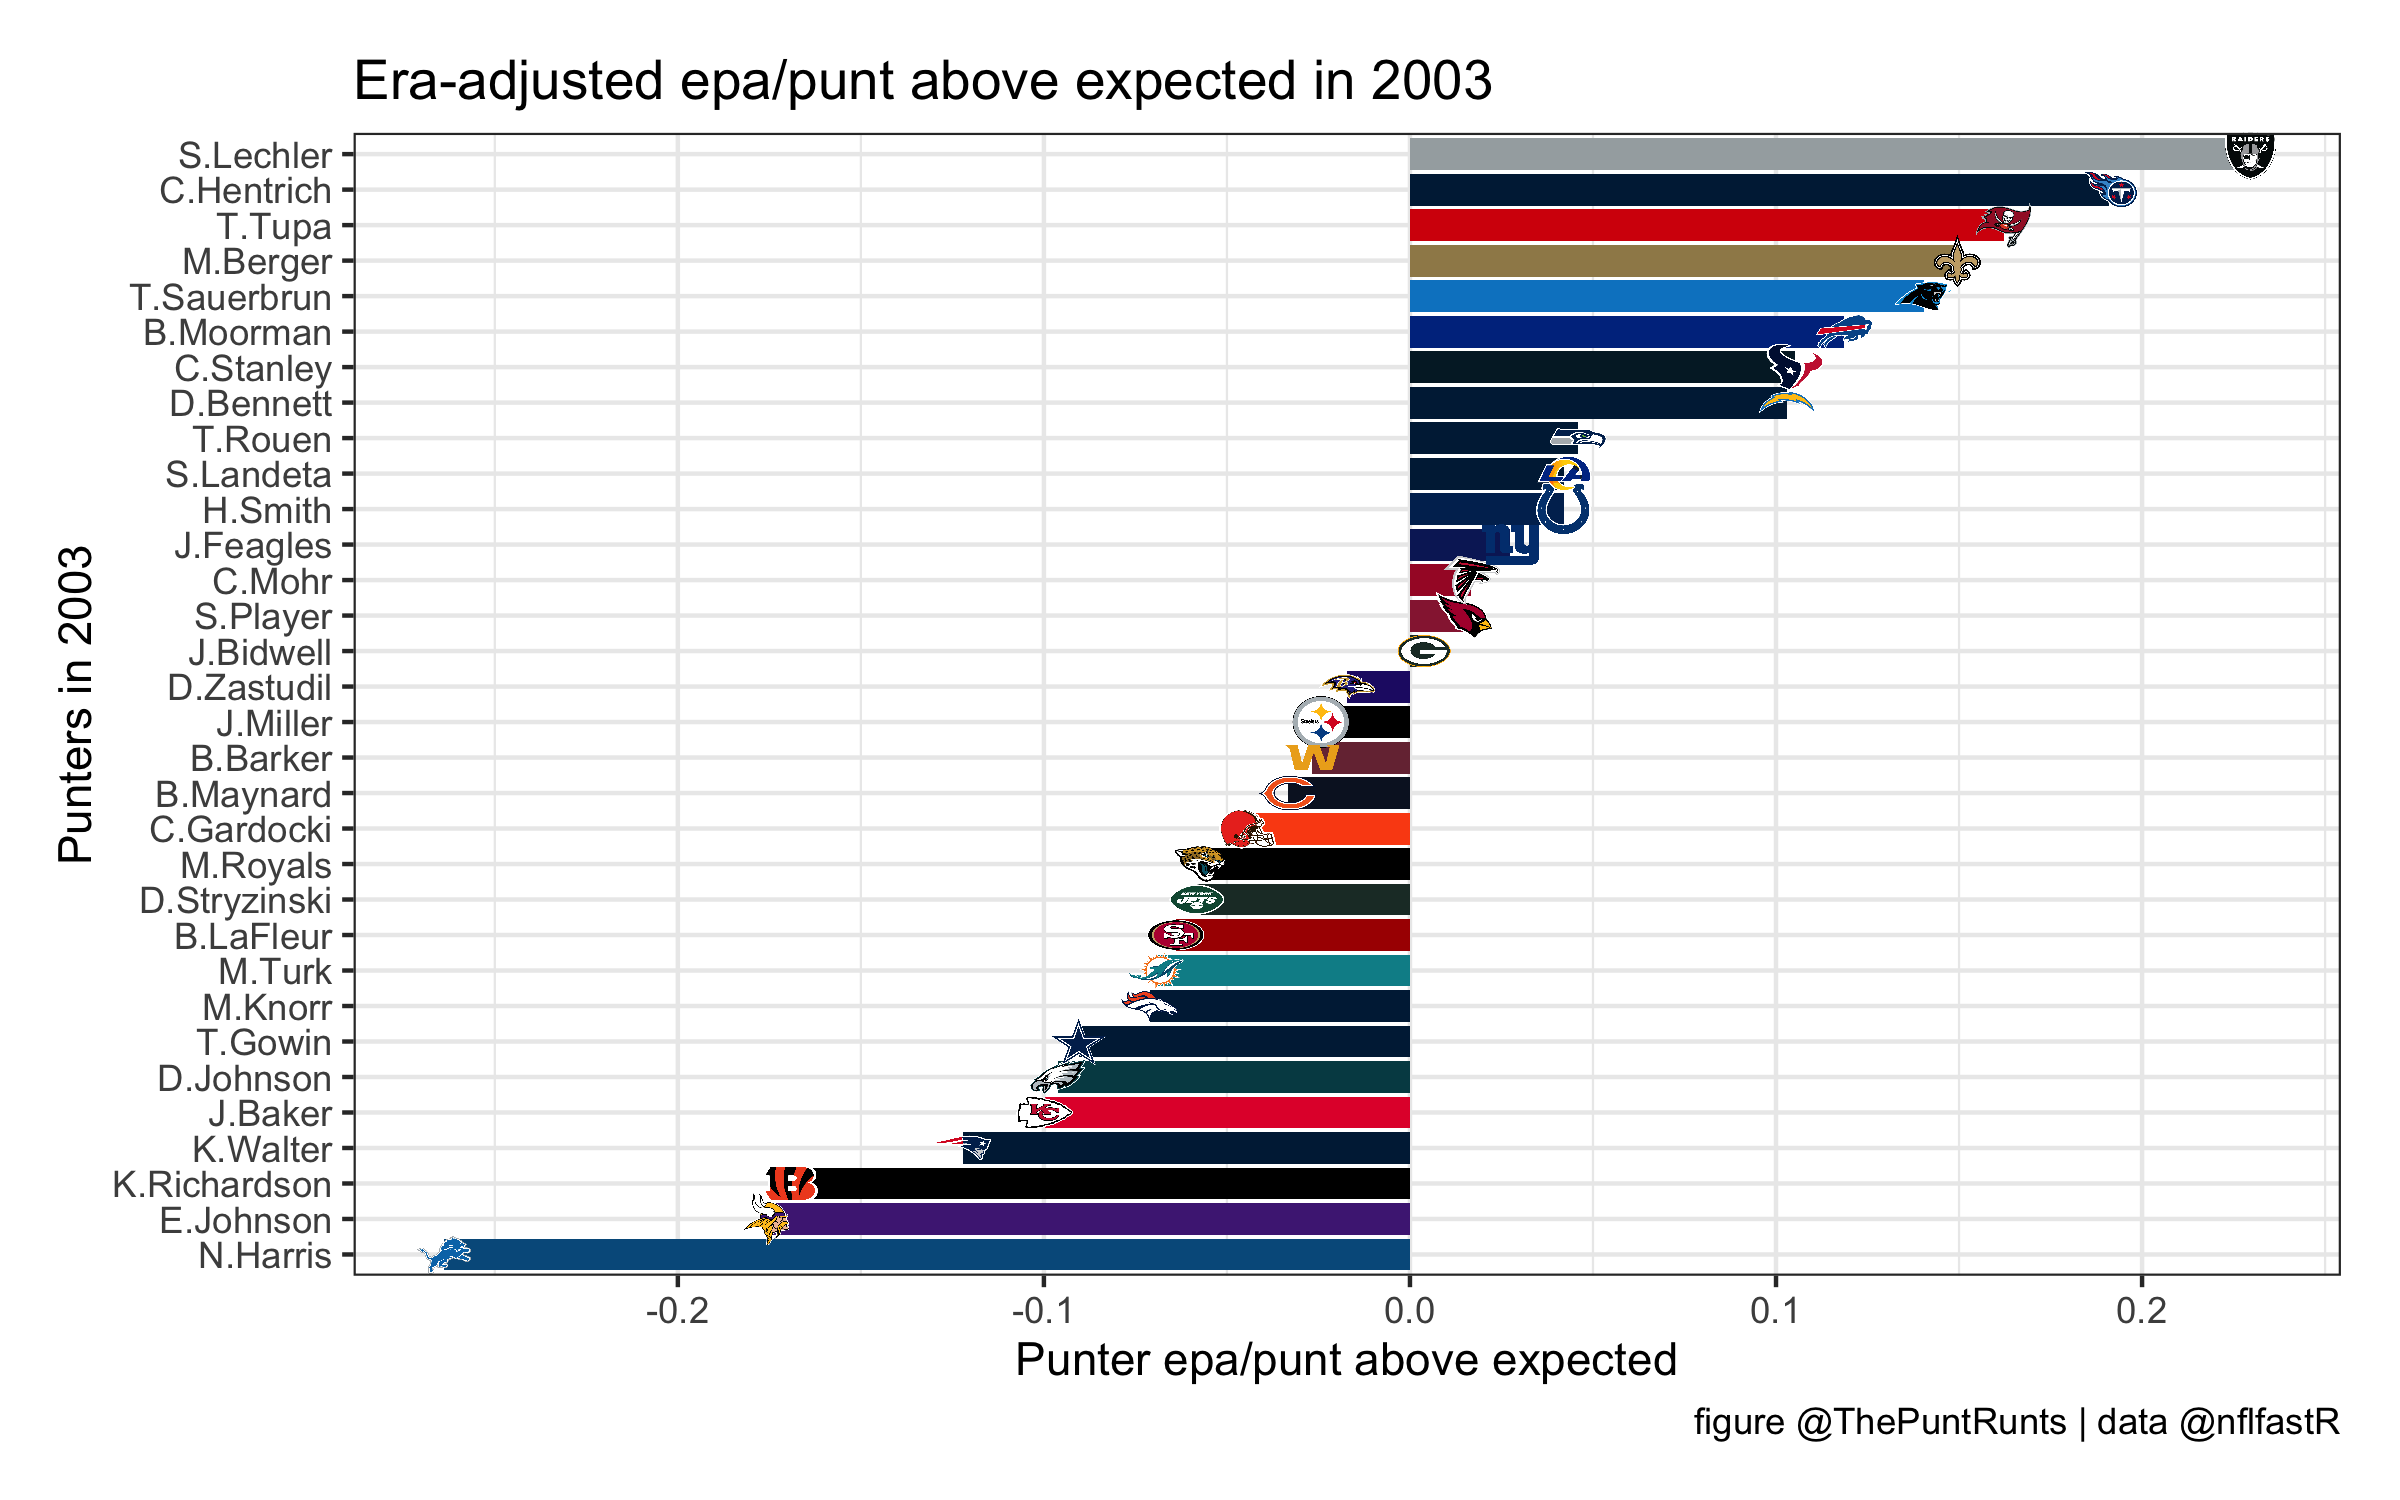
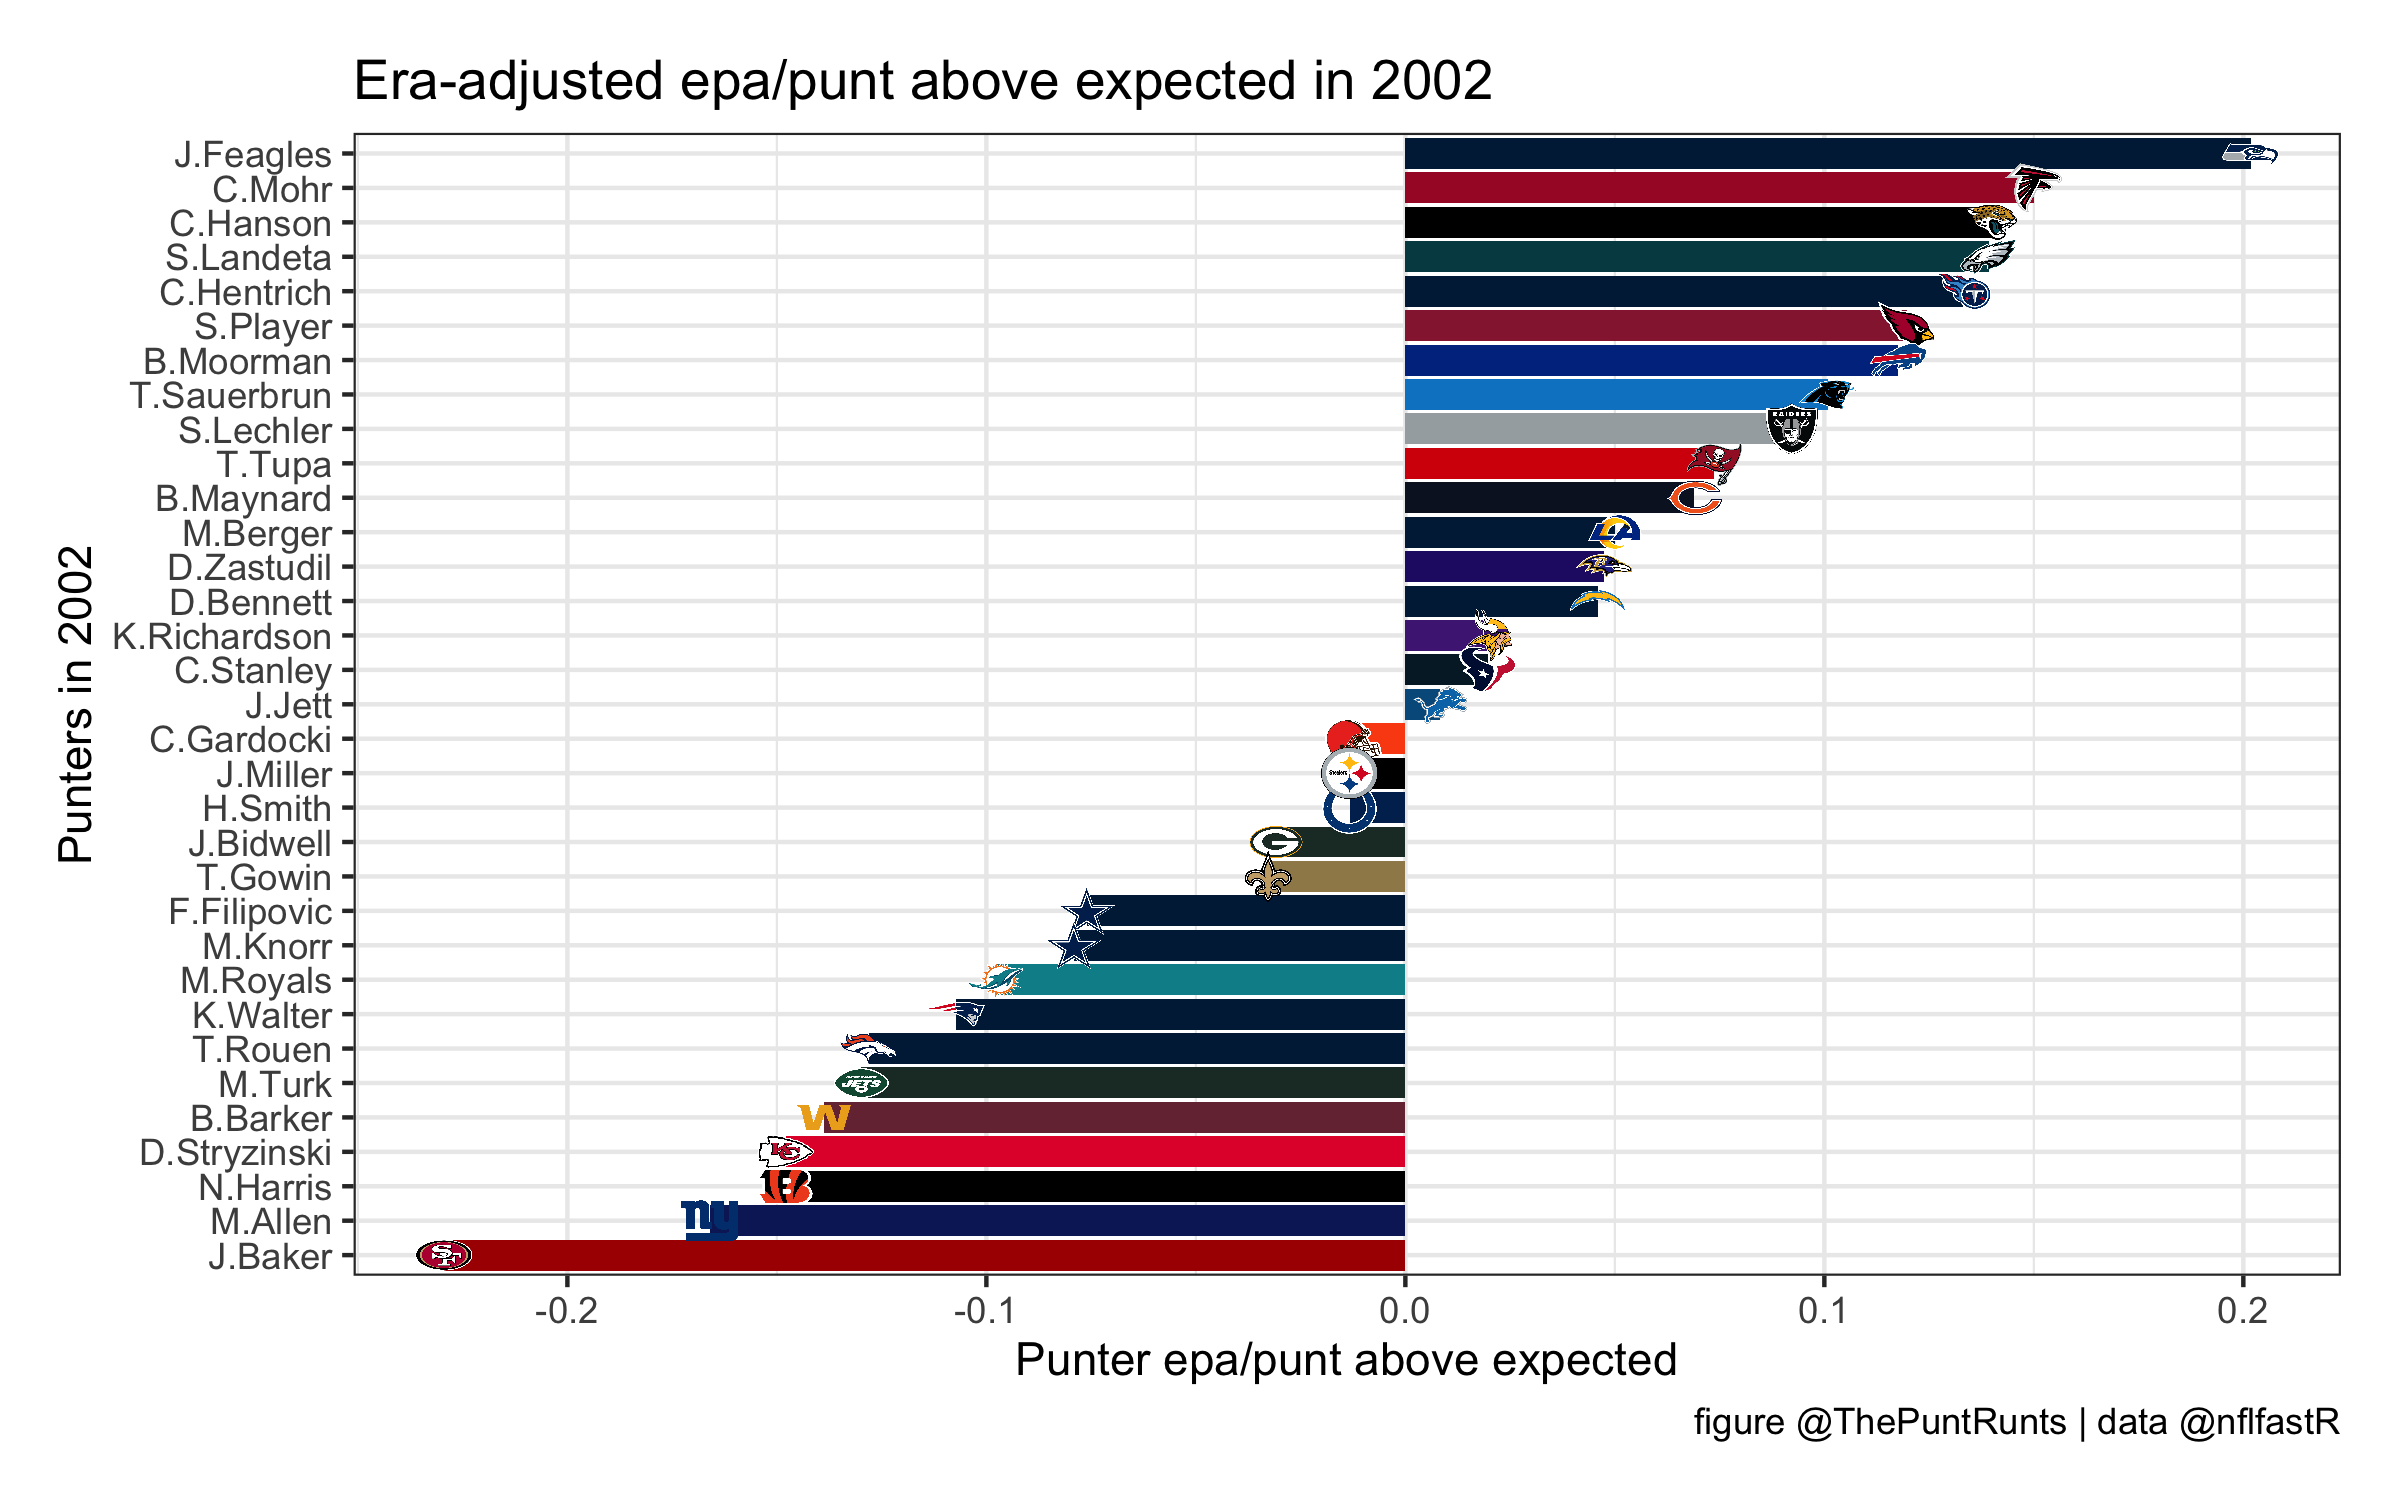
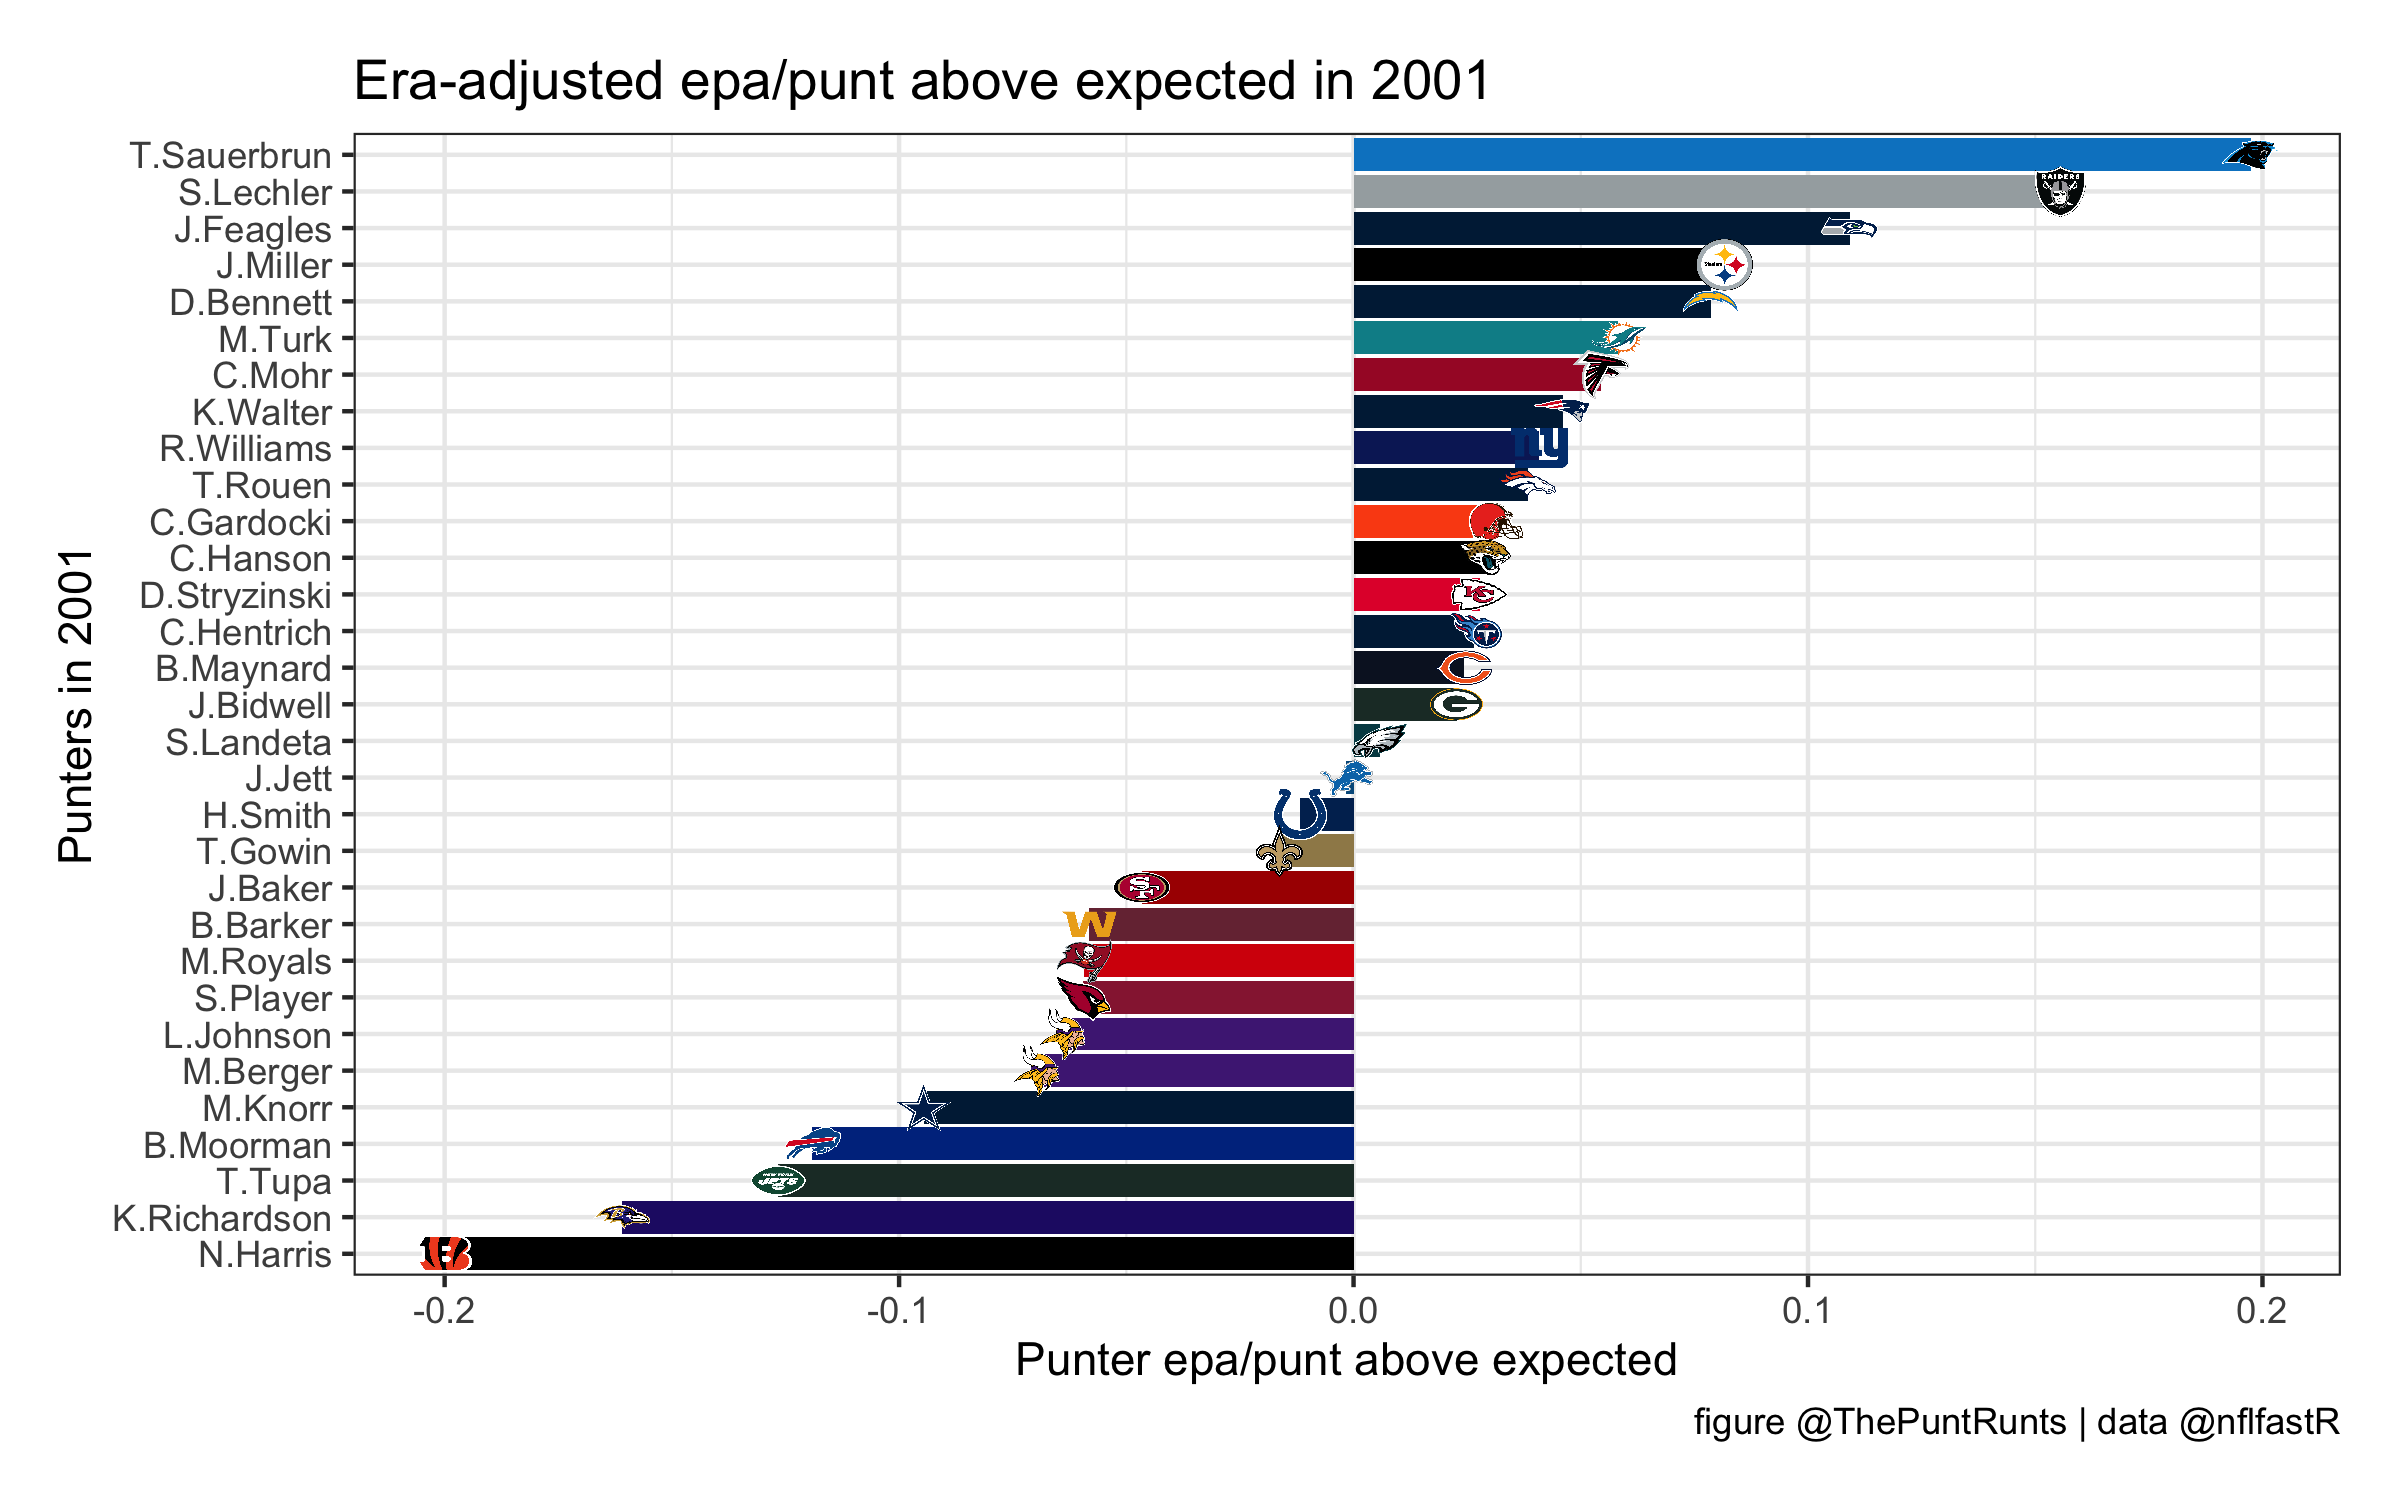
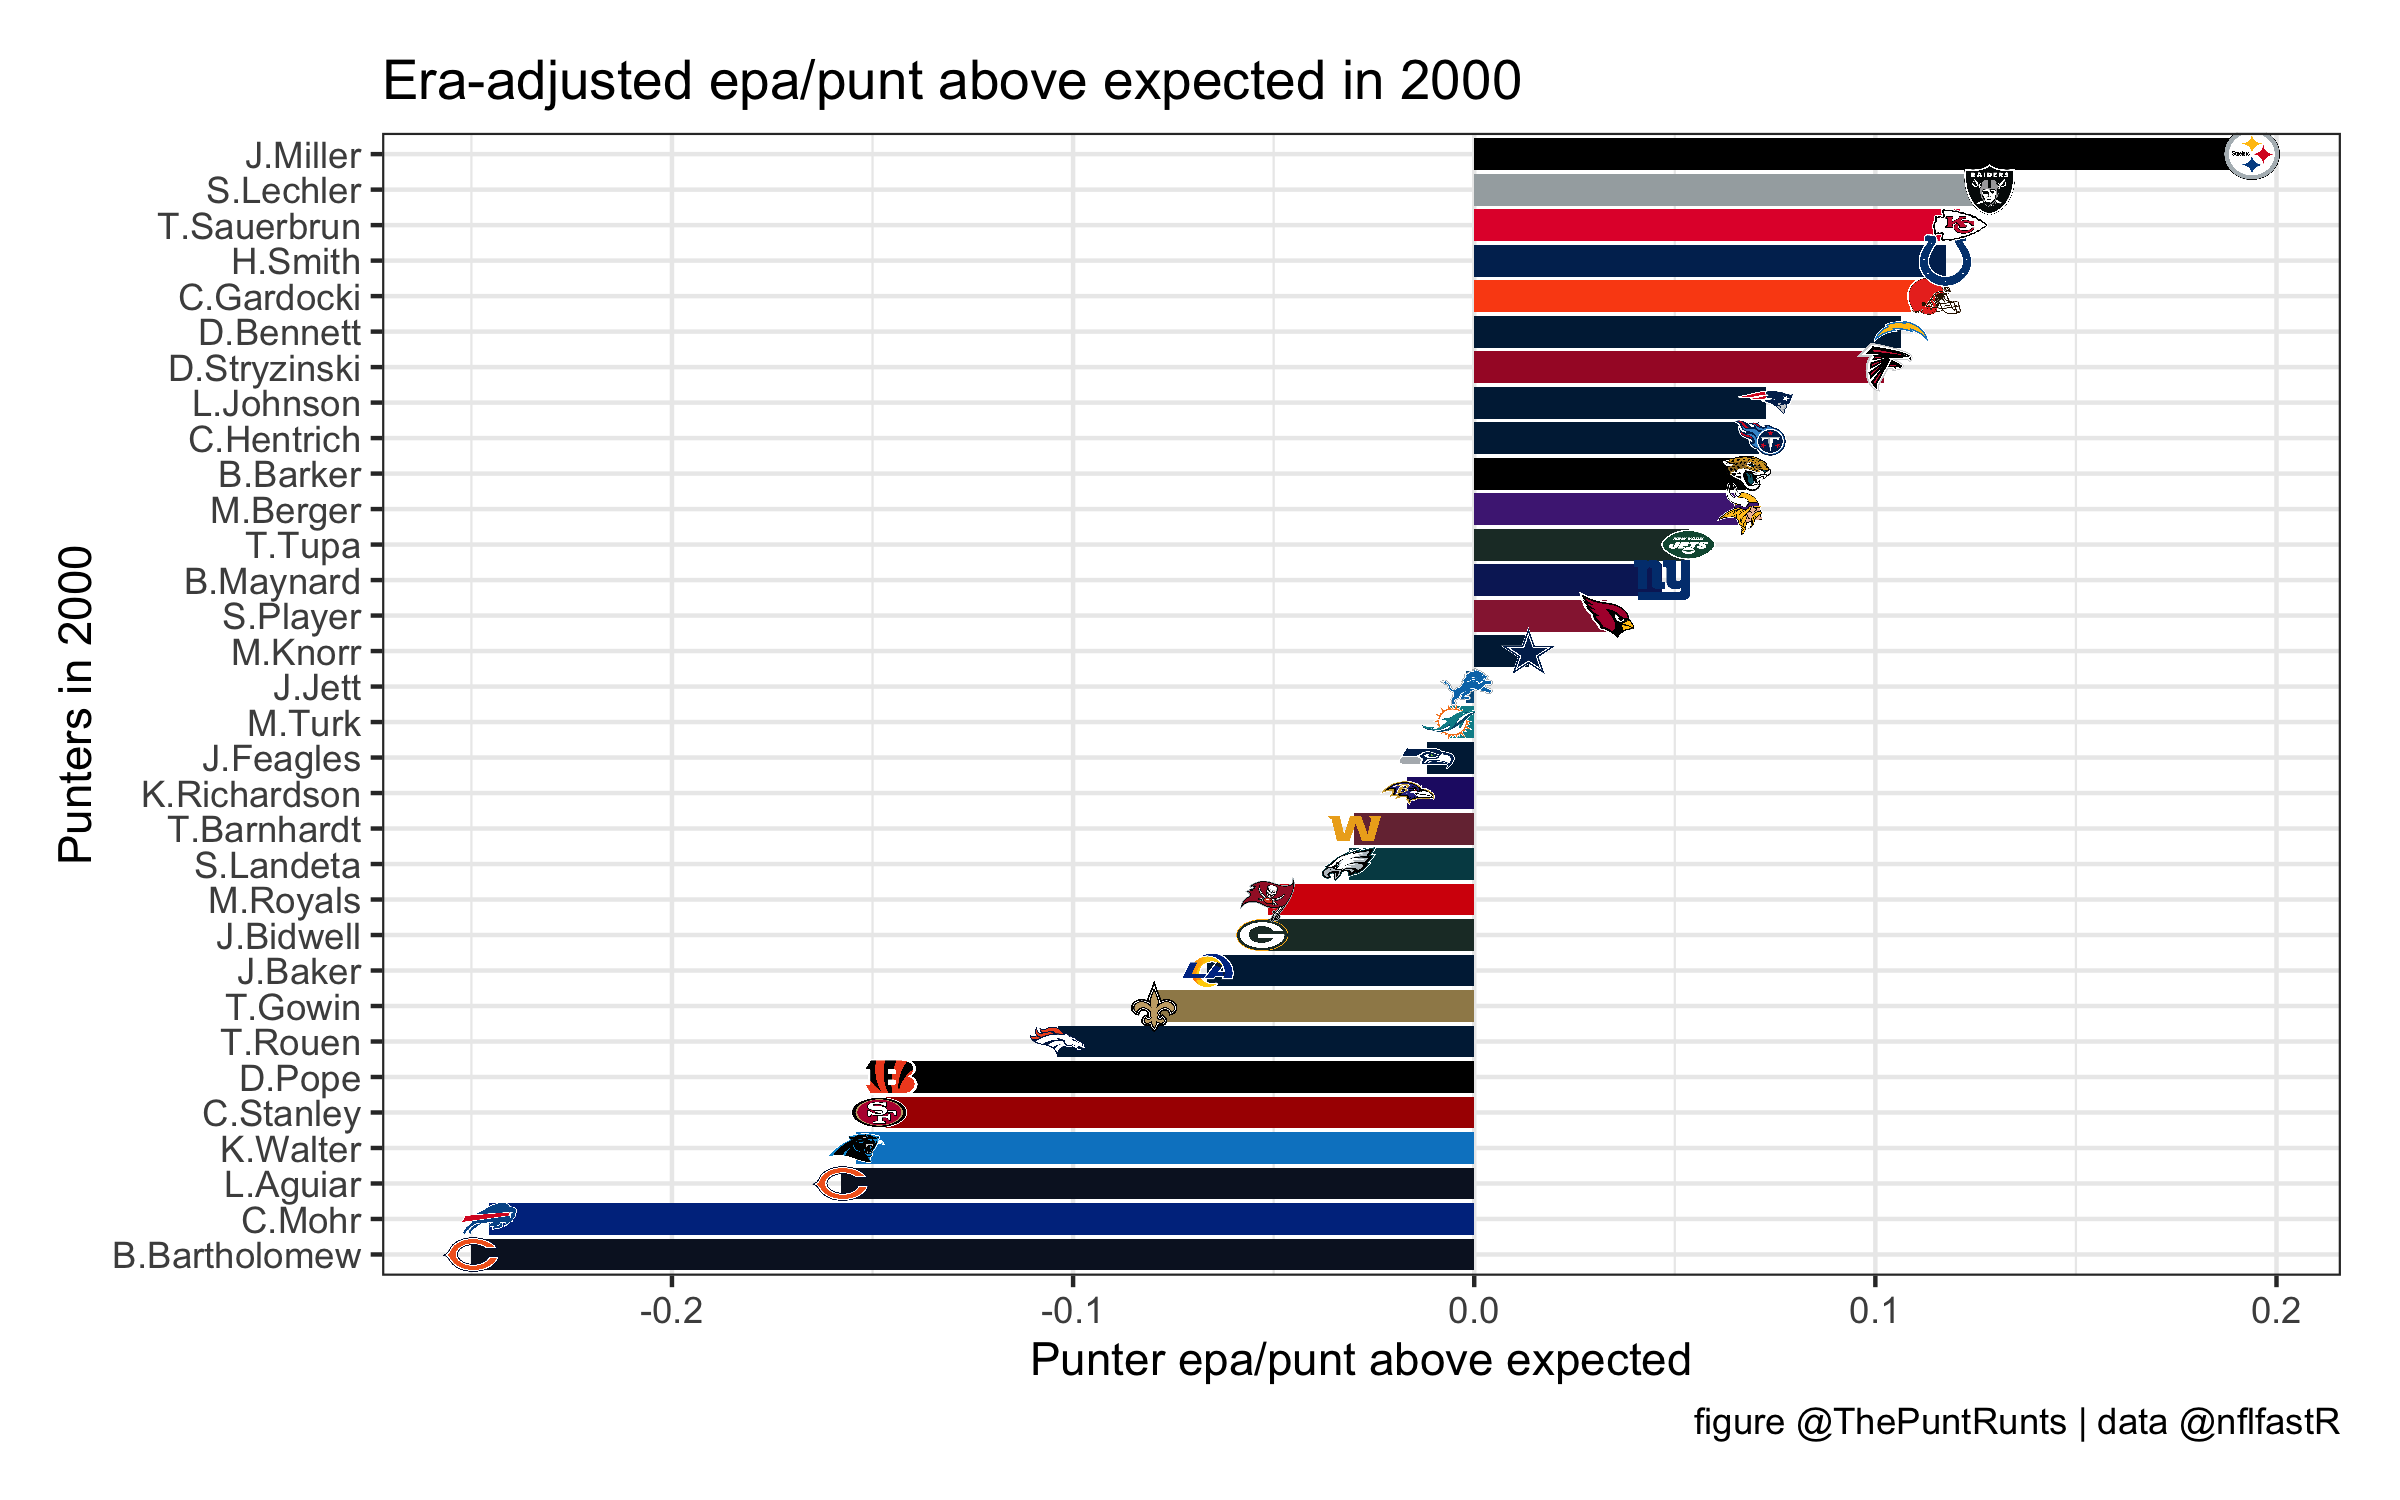
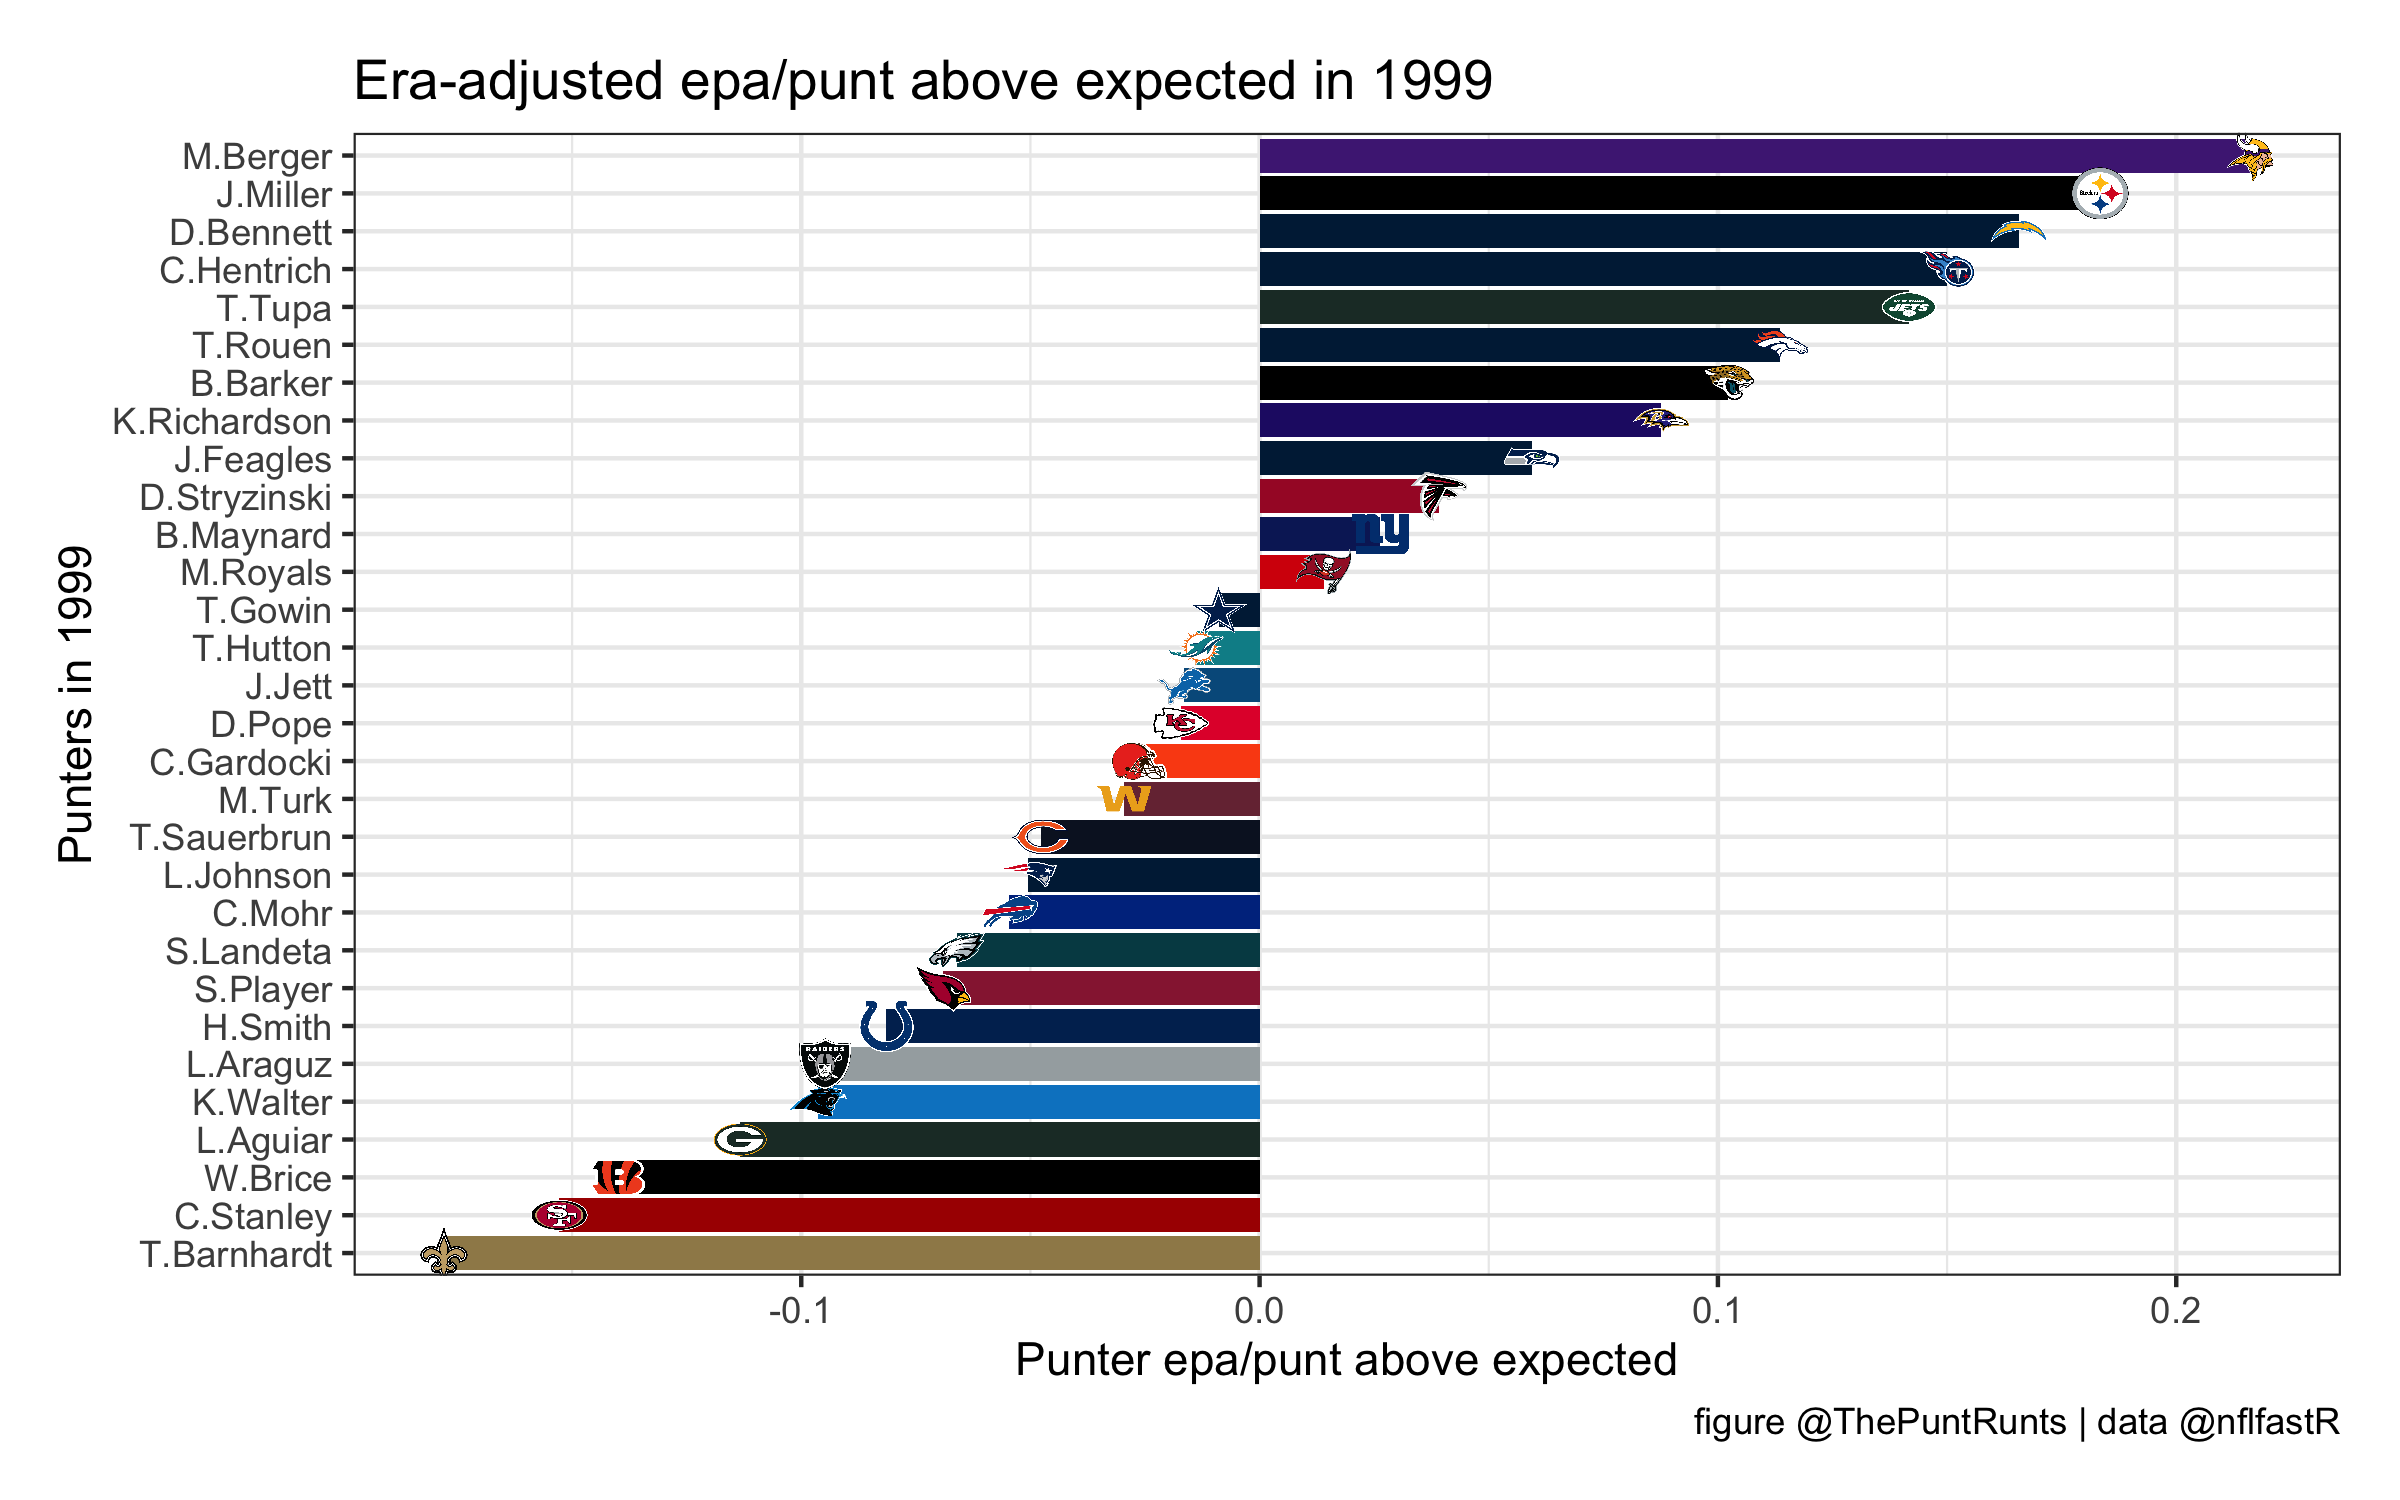
And here’s just pEPA, in the familiar horizontal bar plot we’re always tweeting:
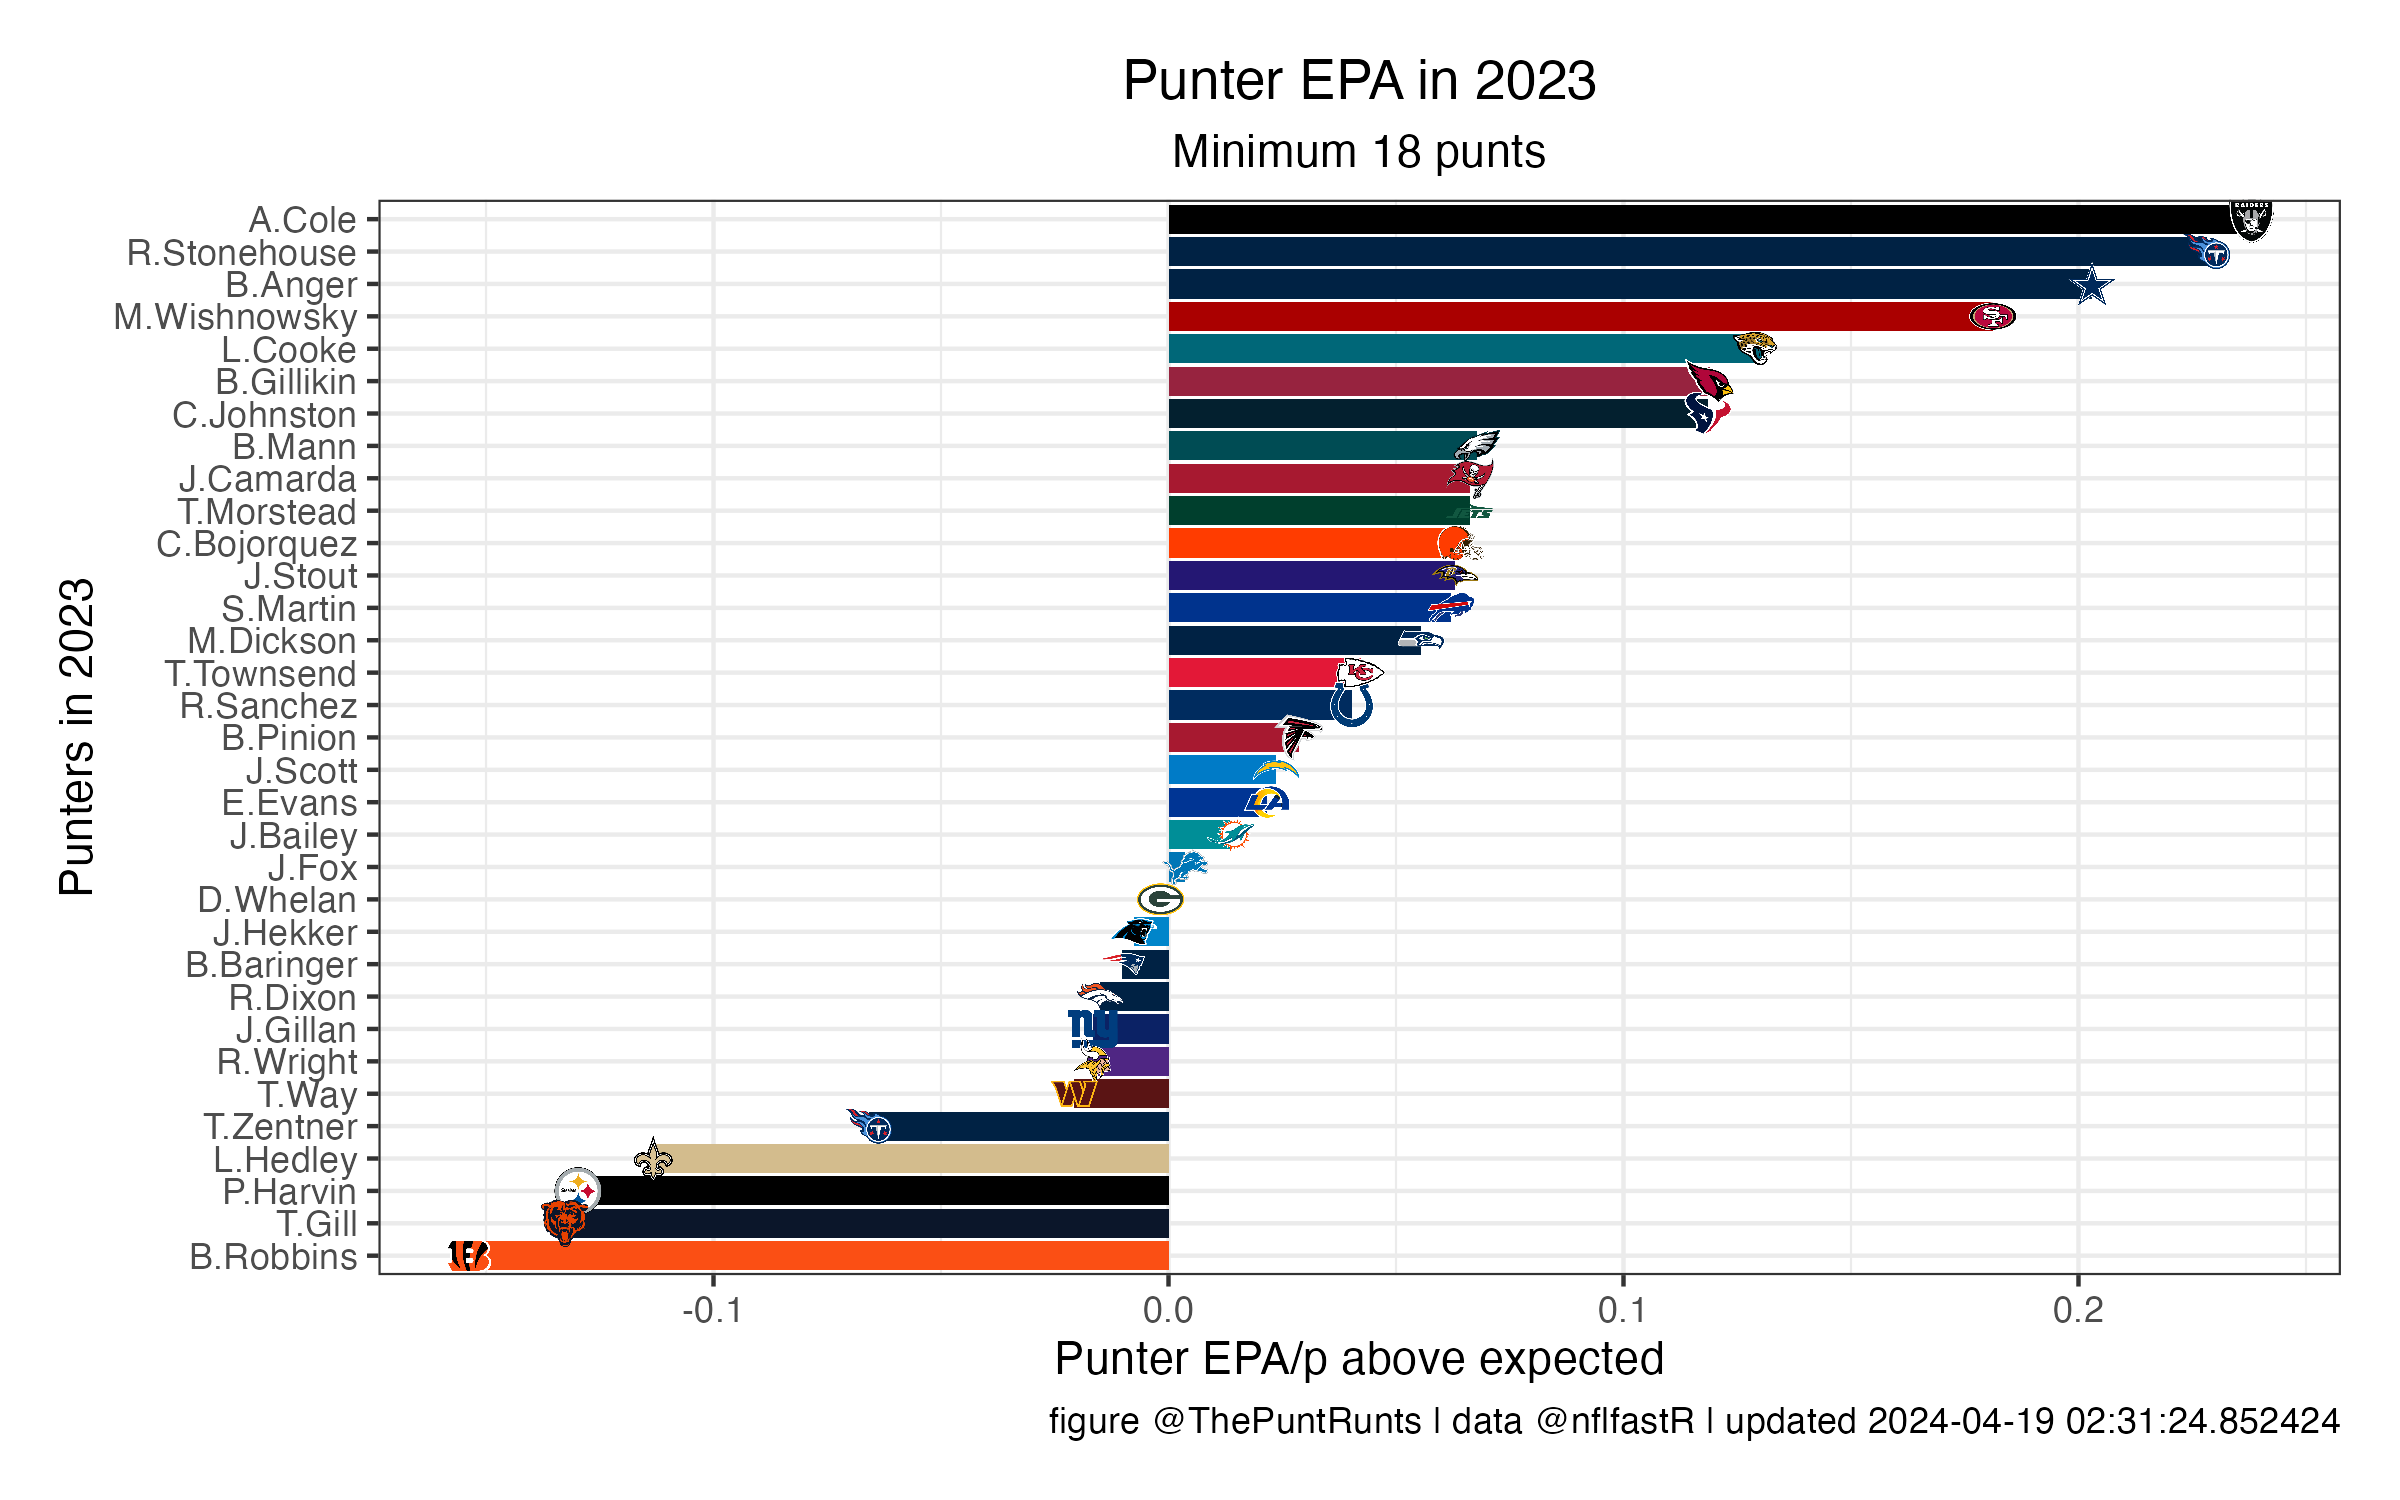
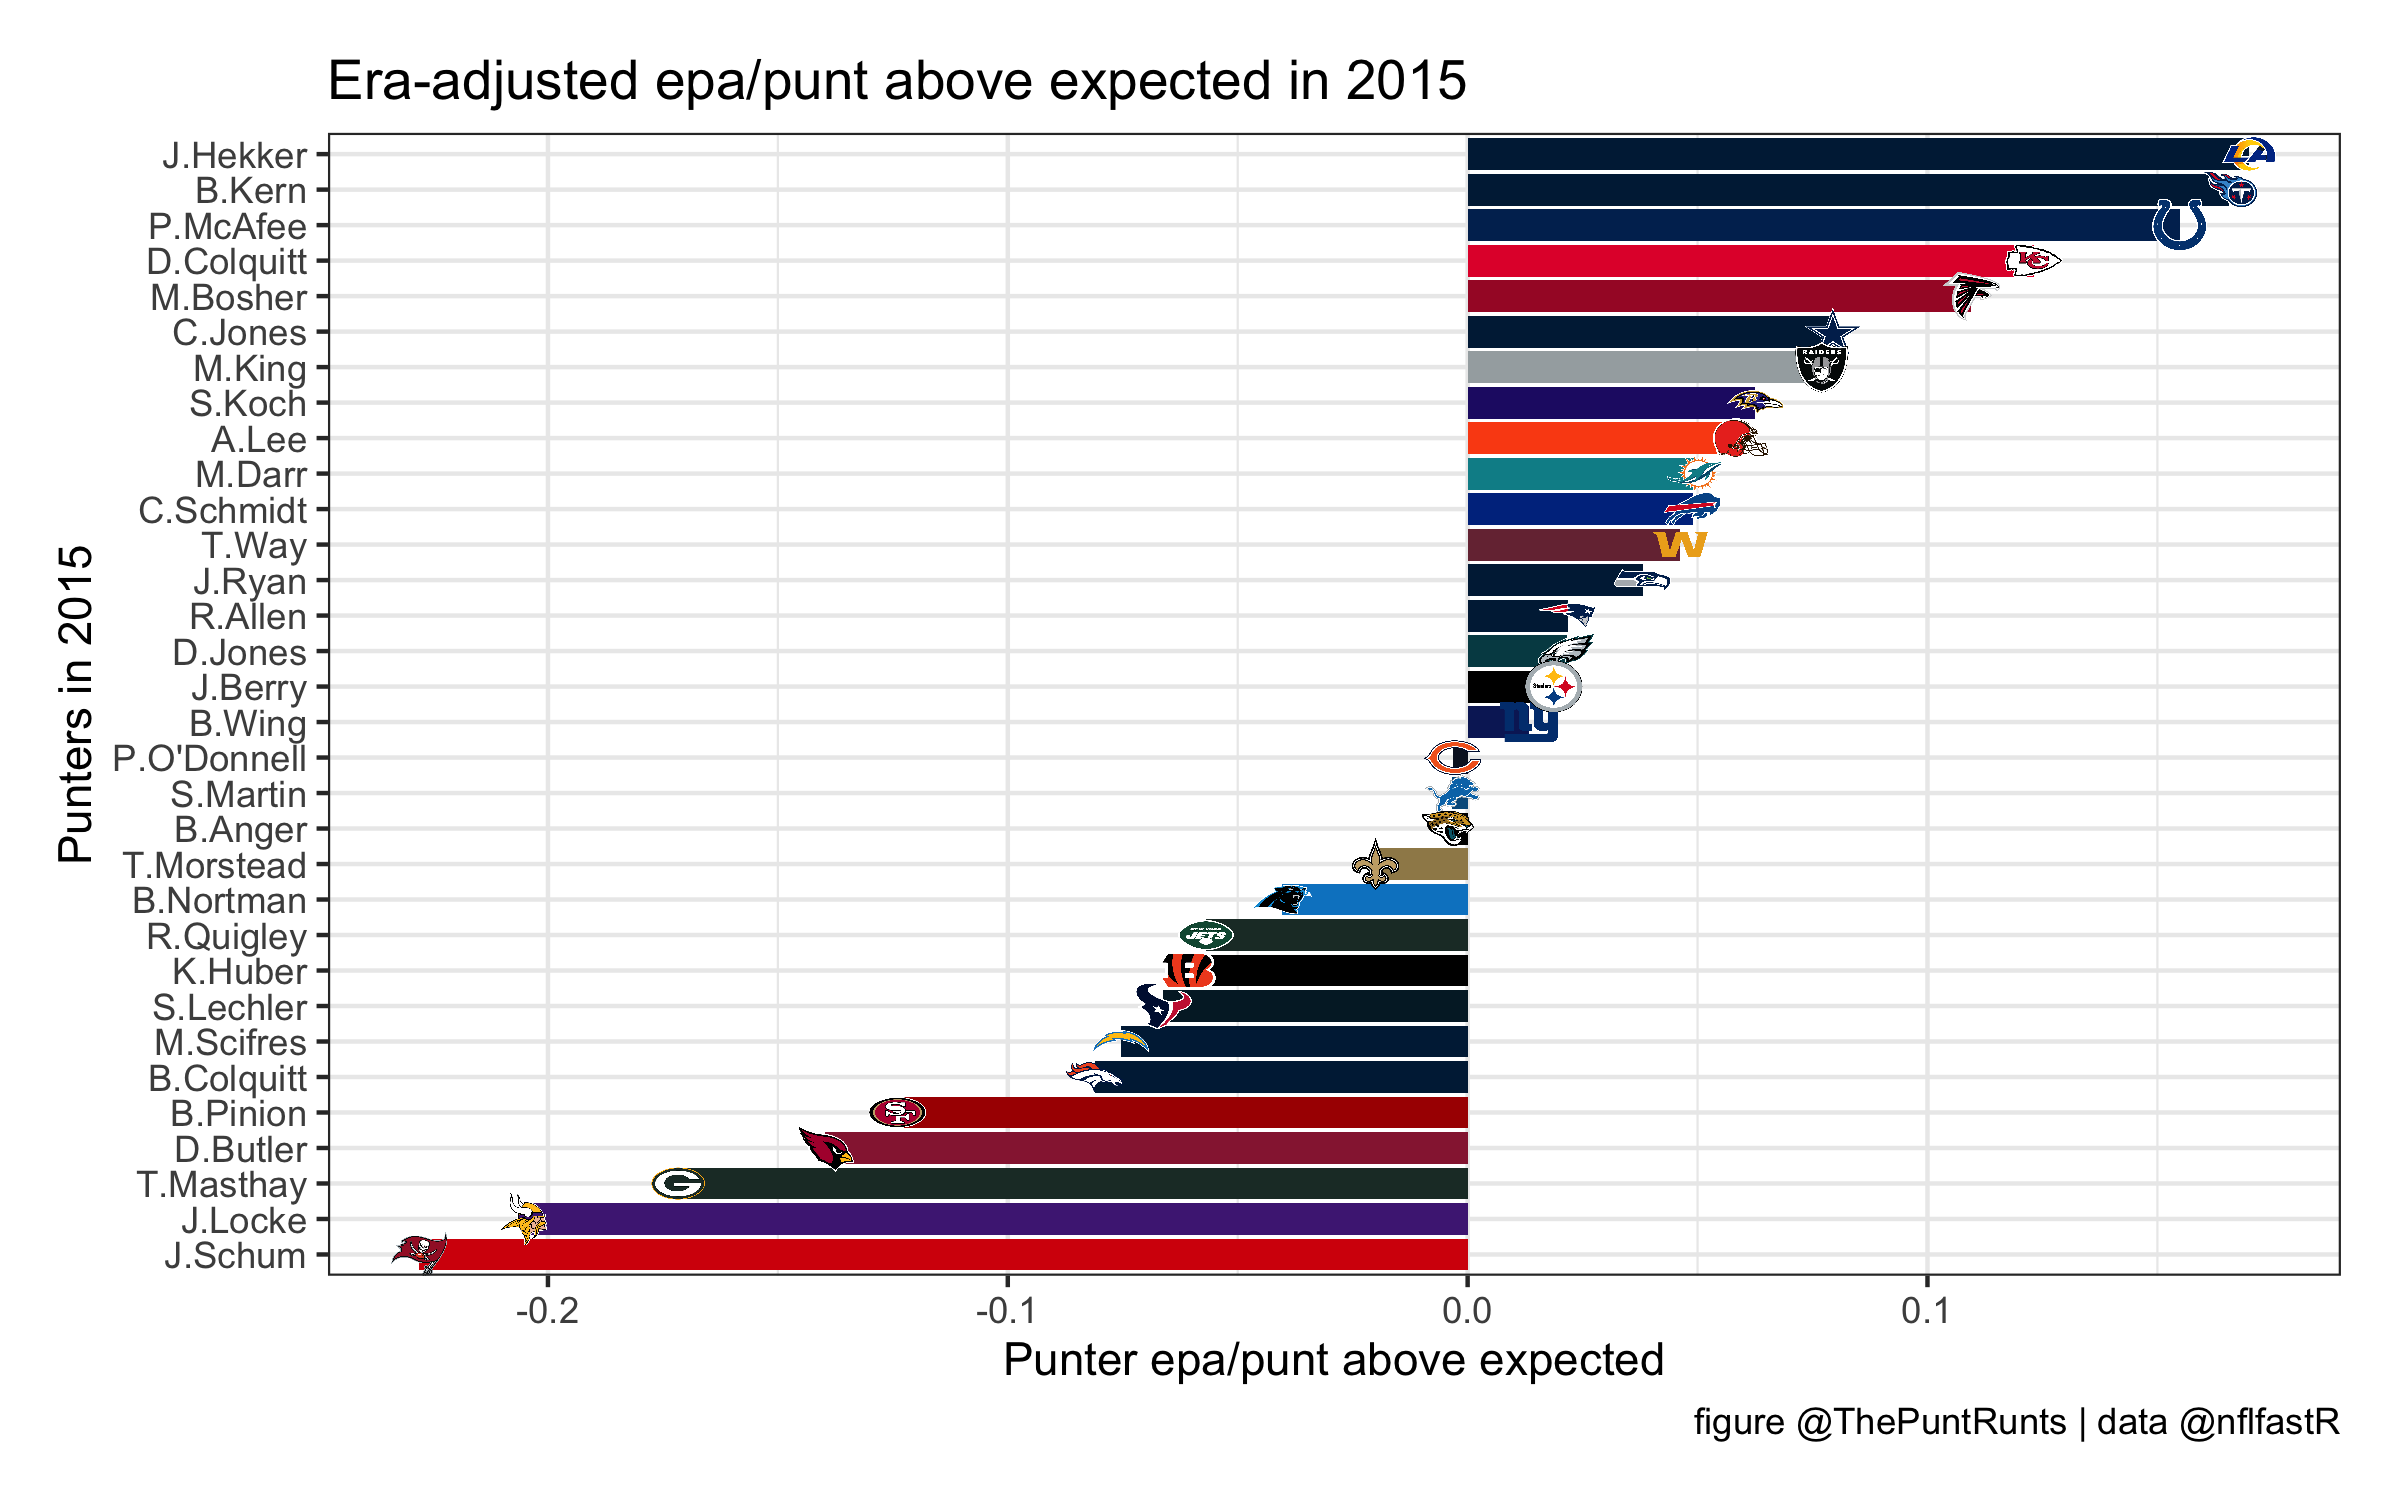
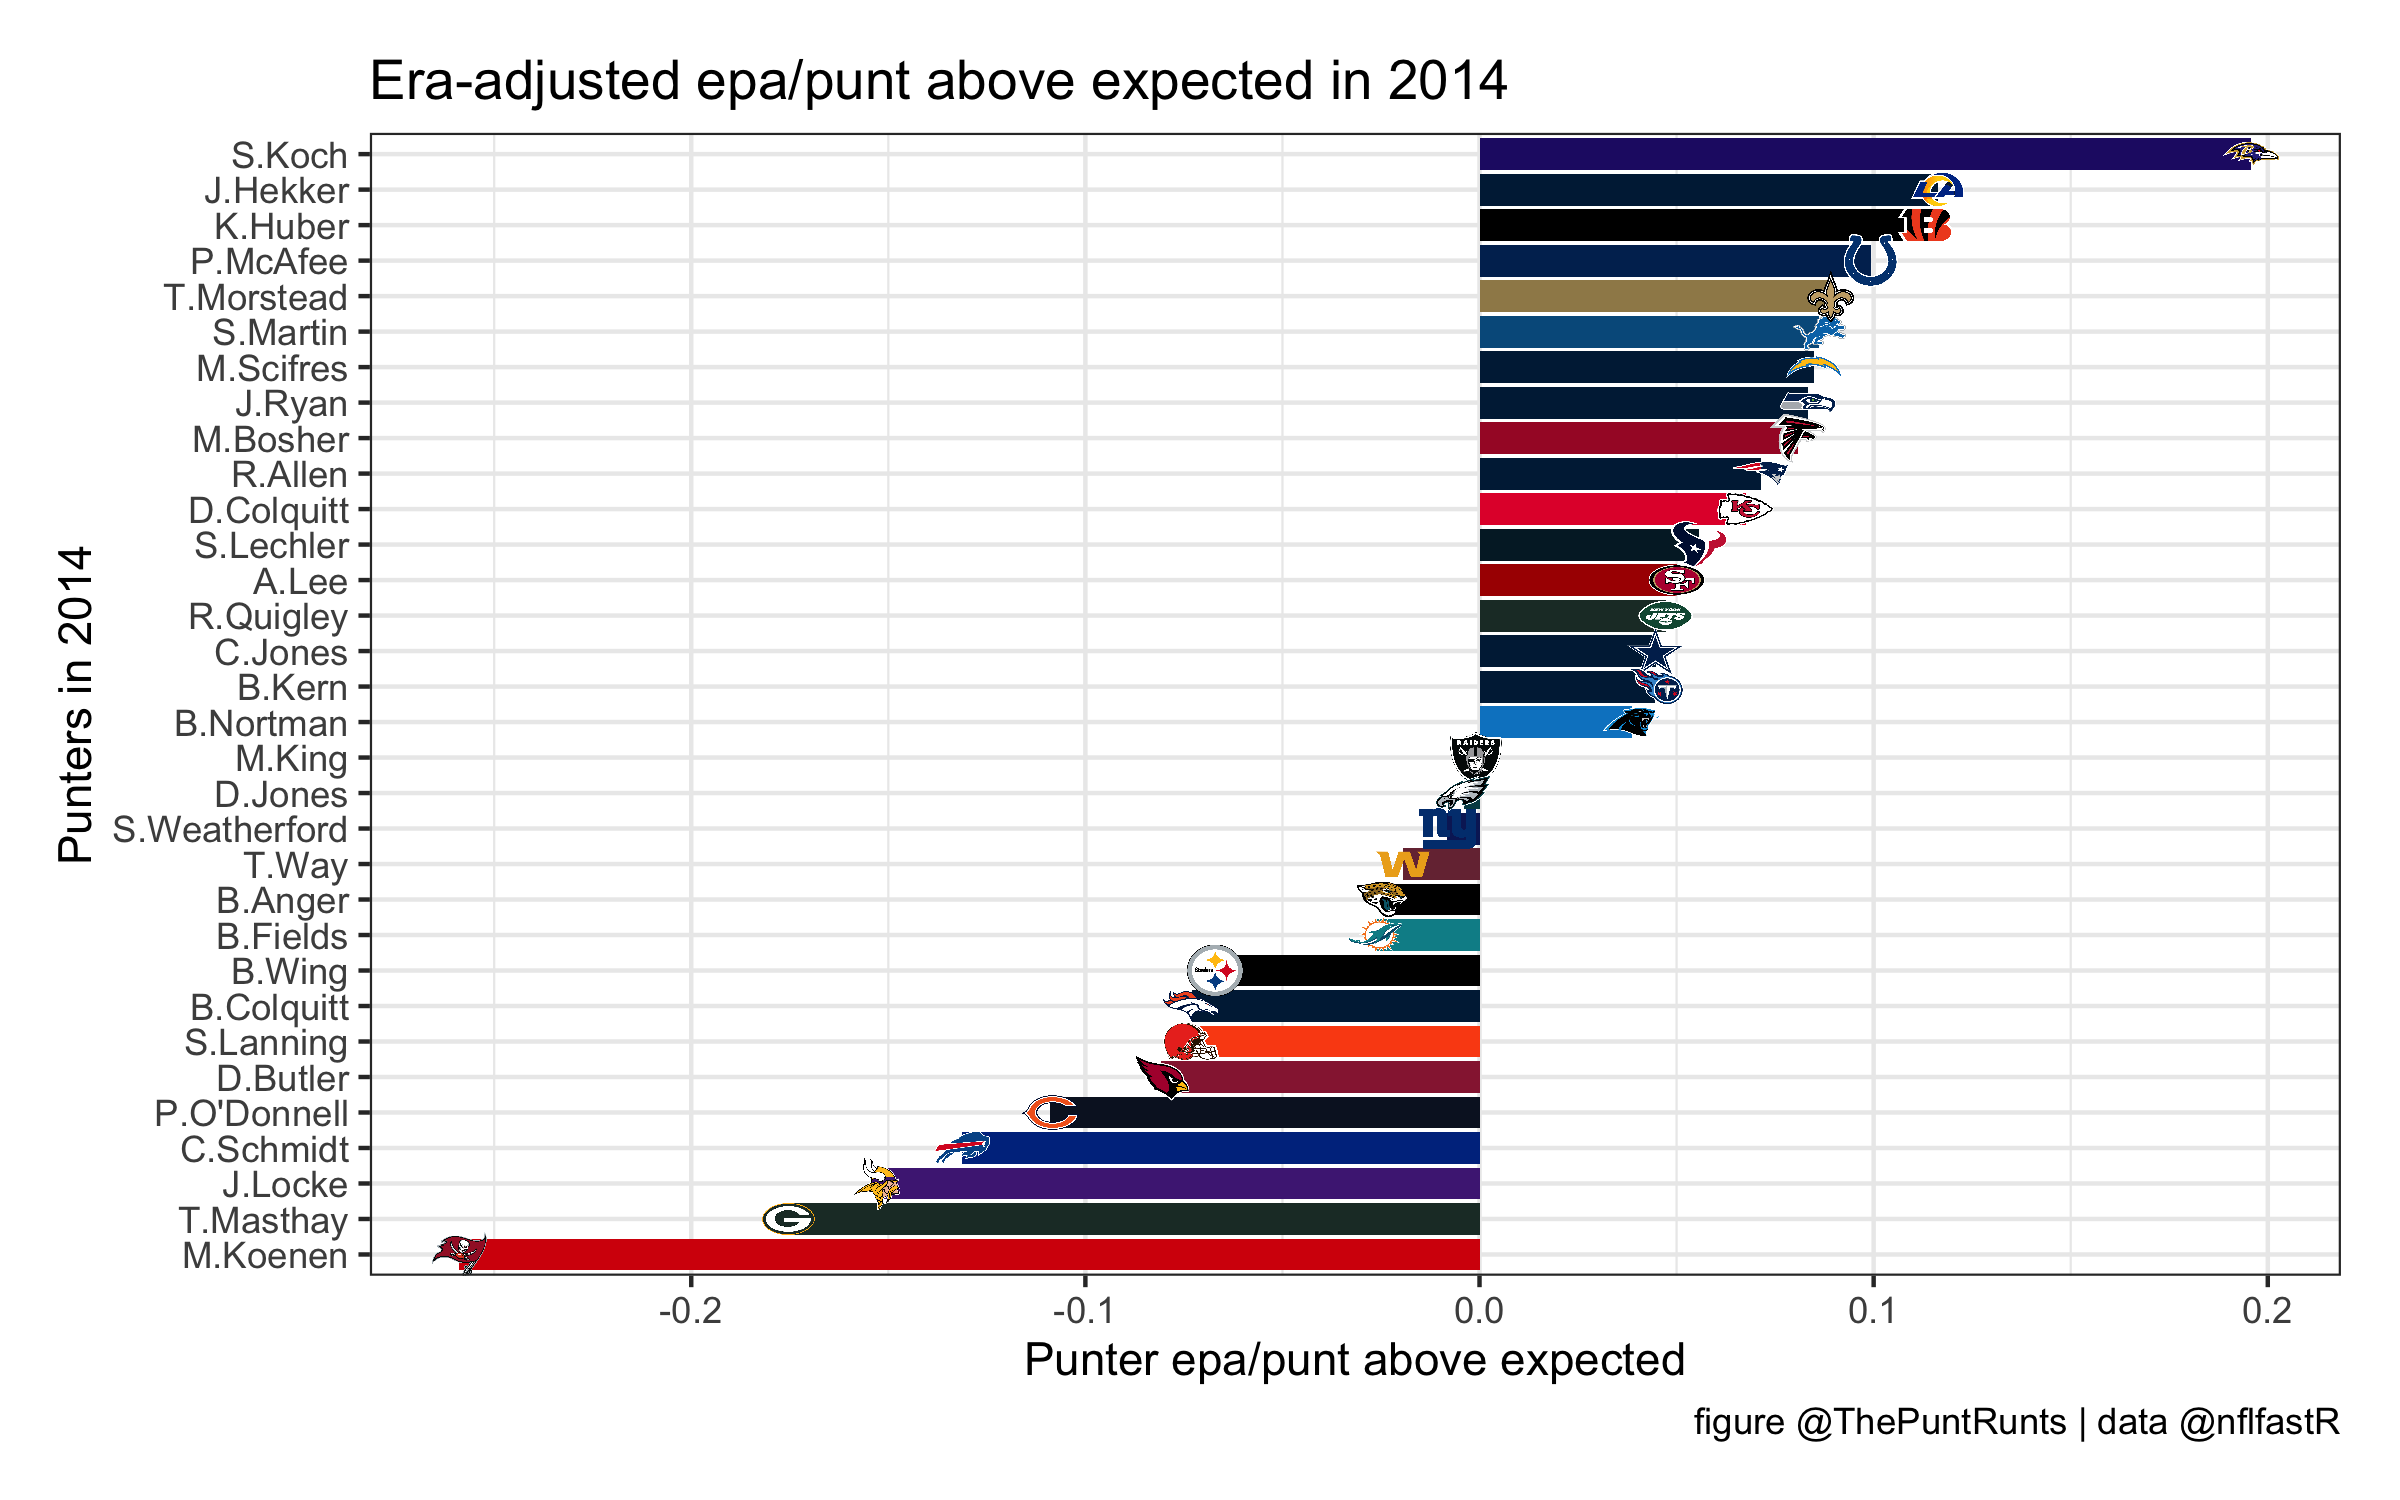
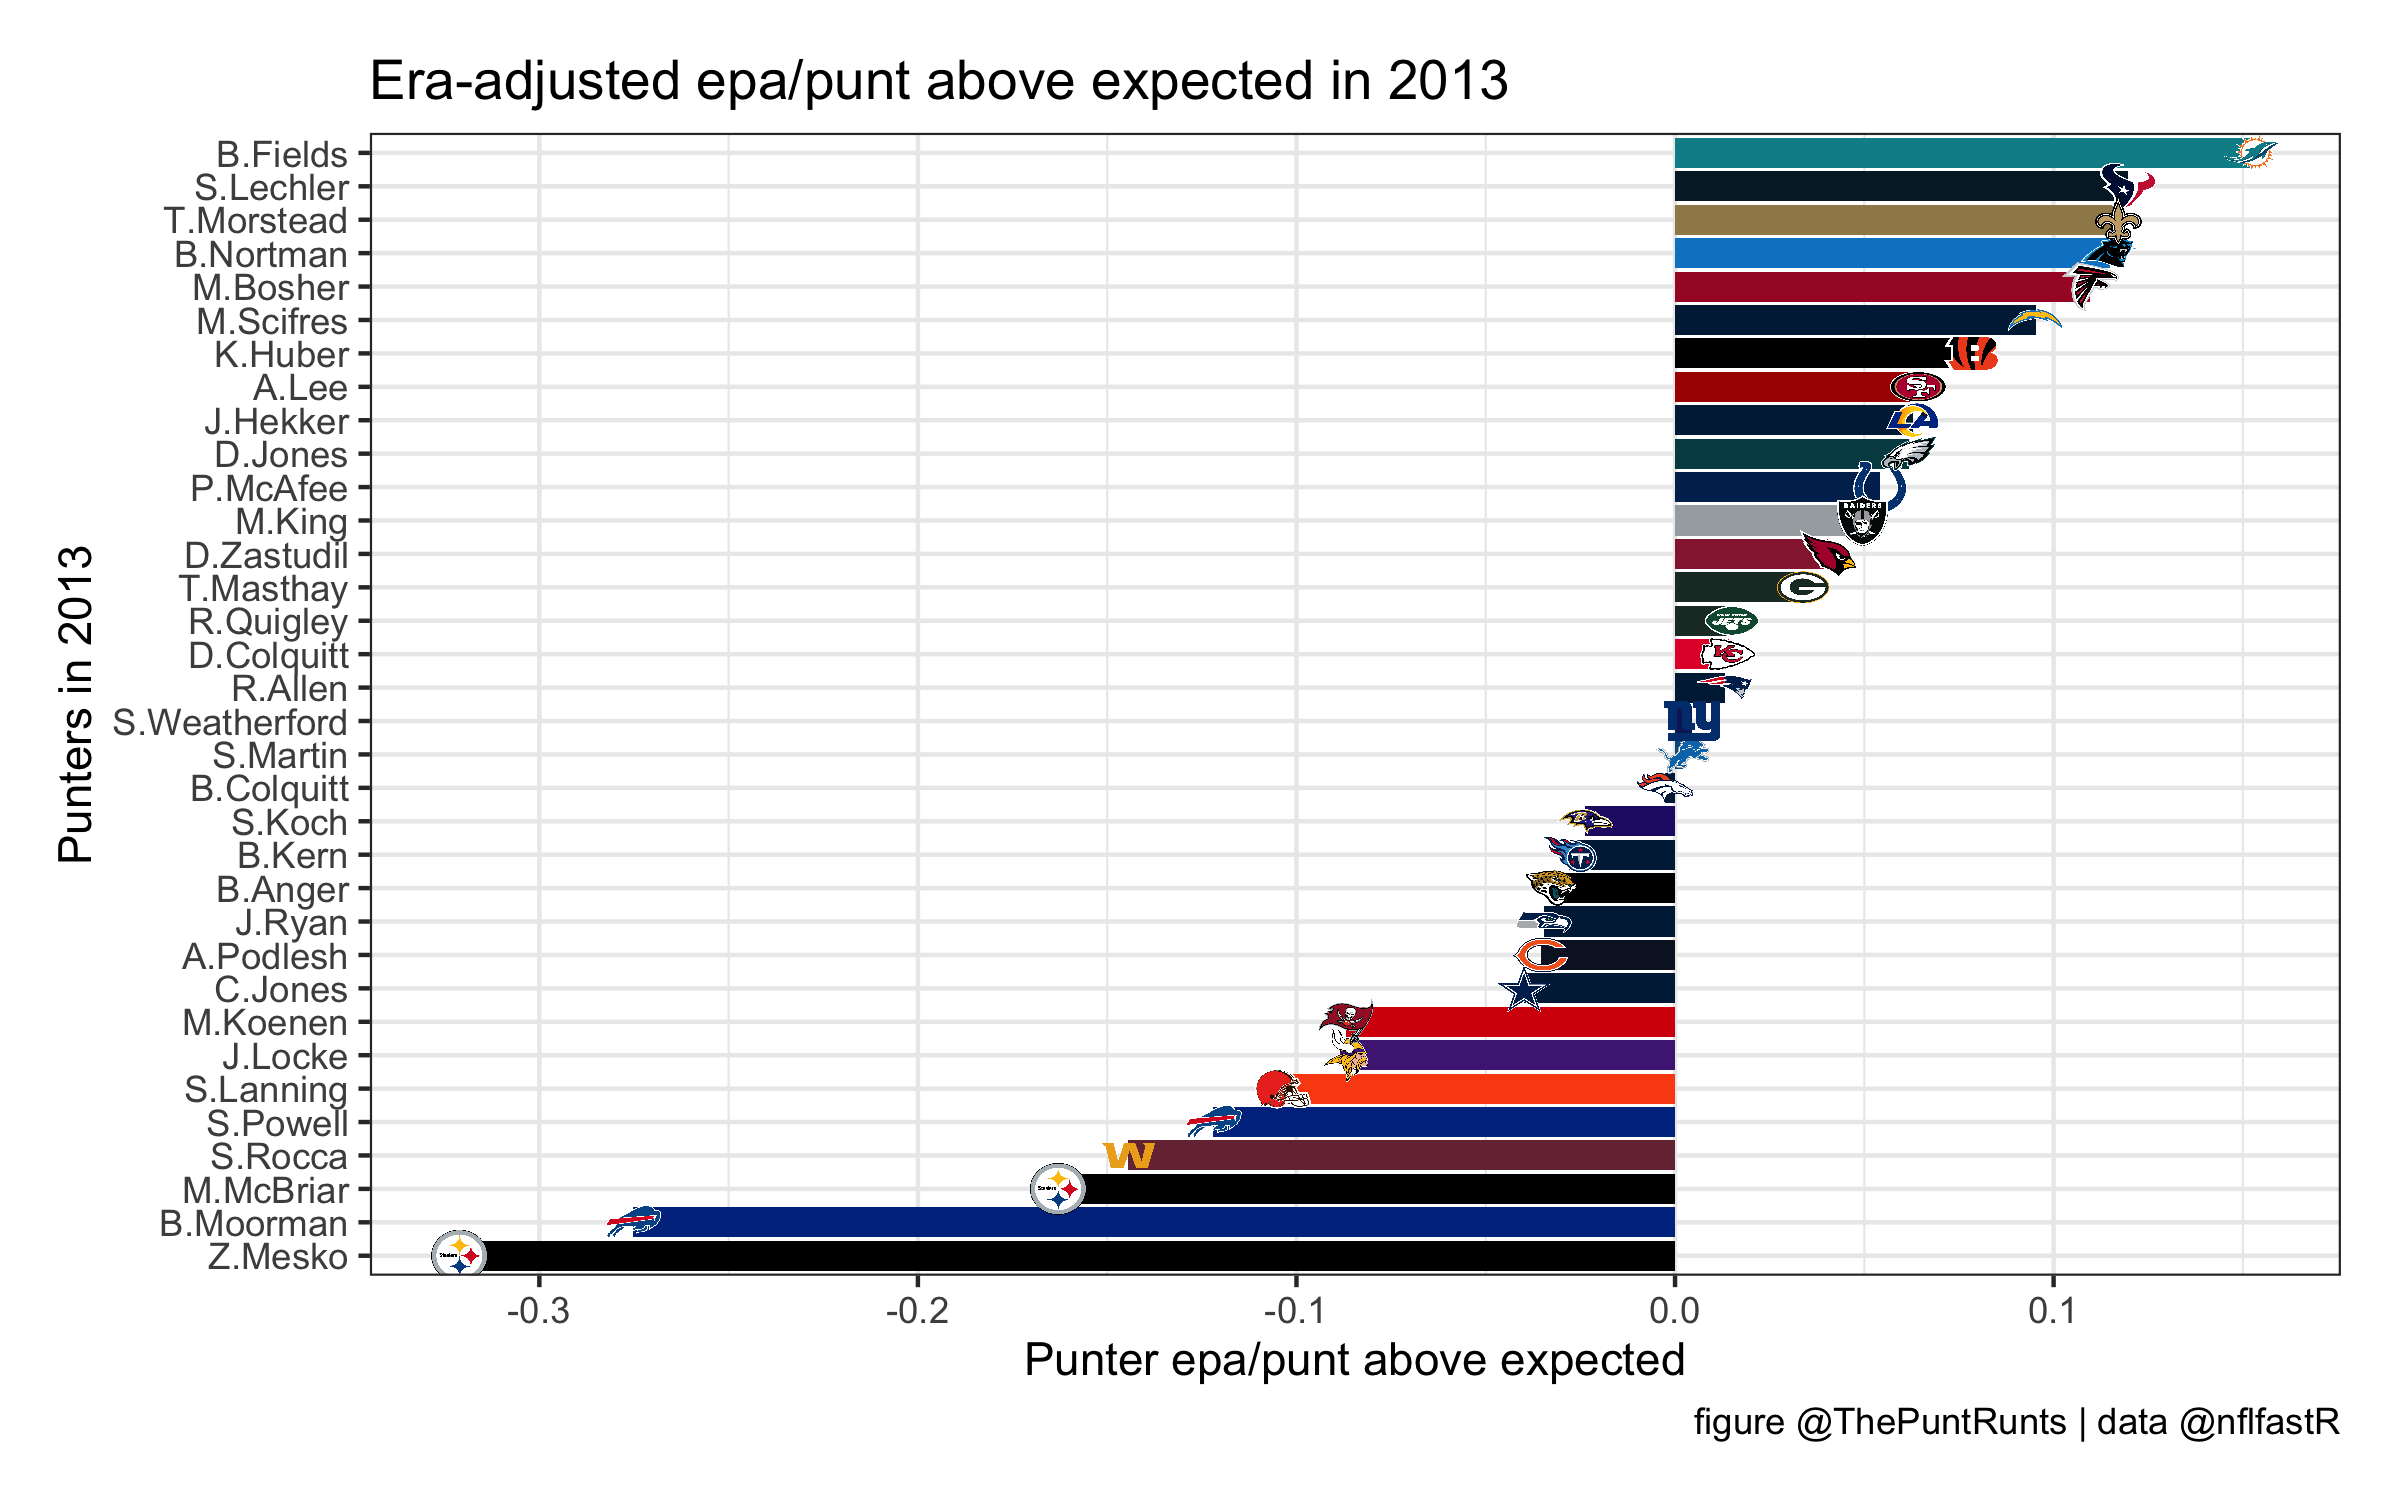
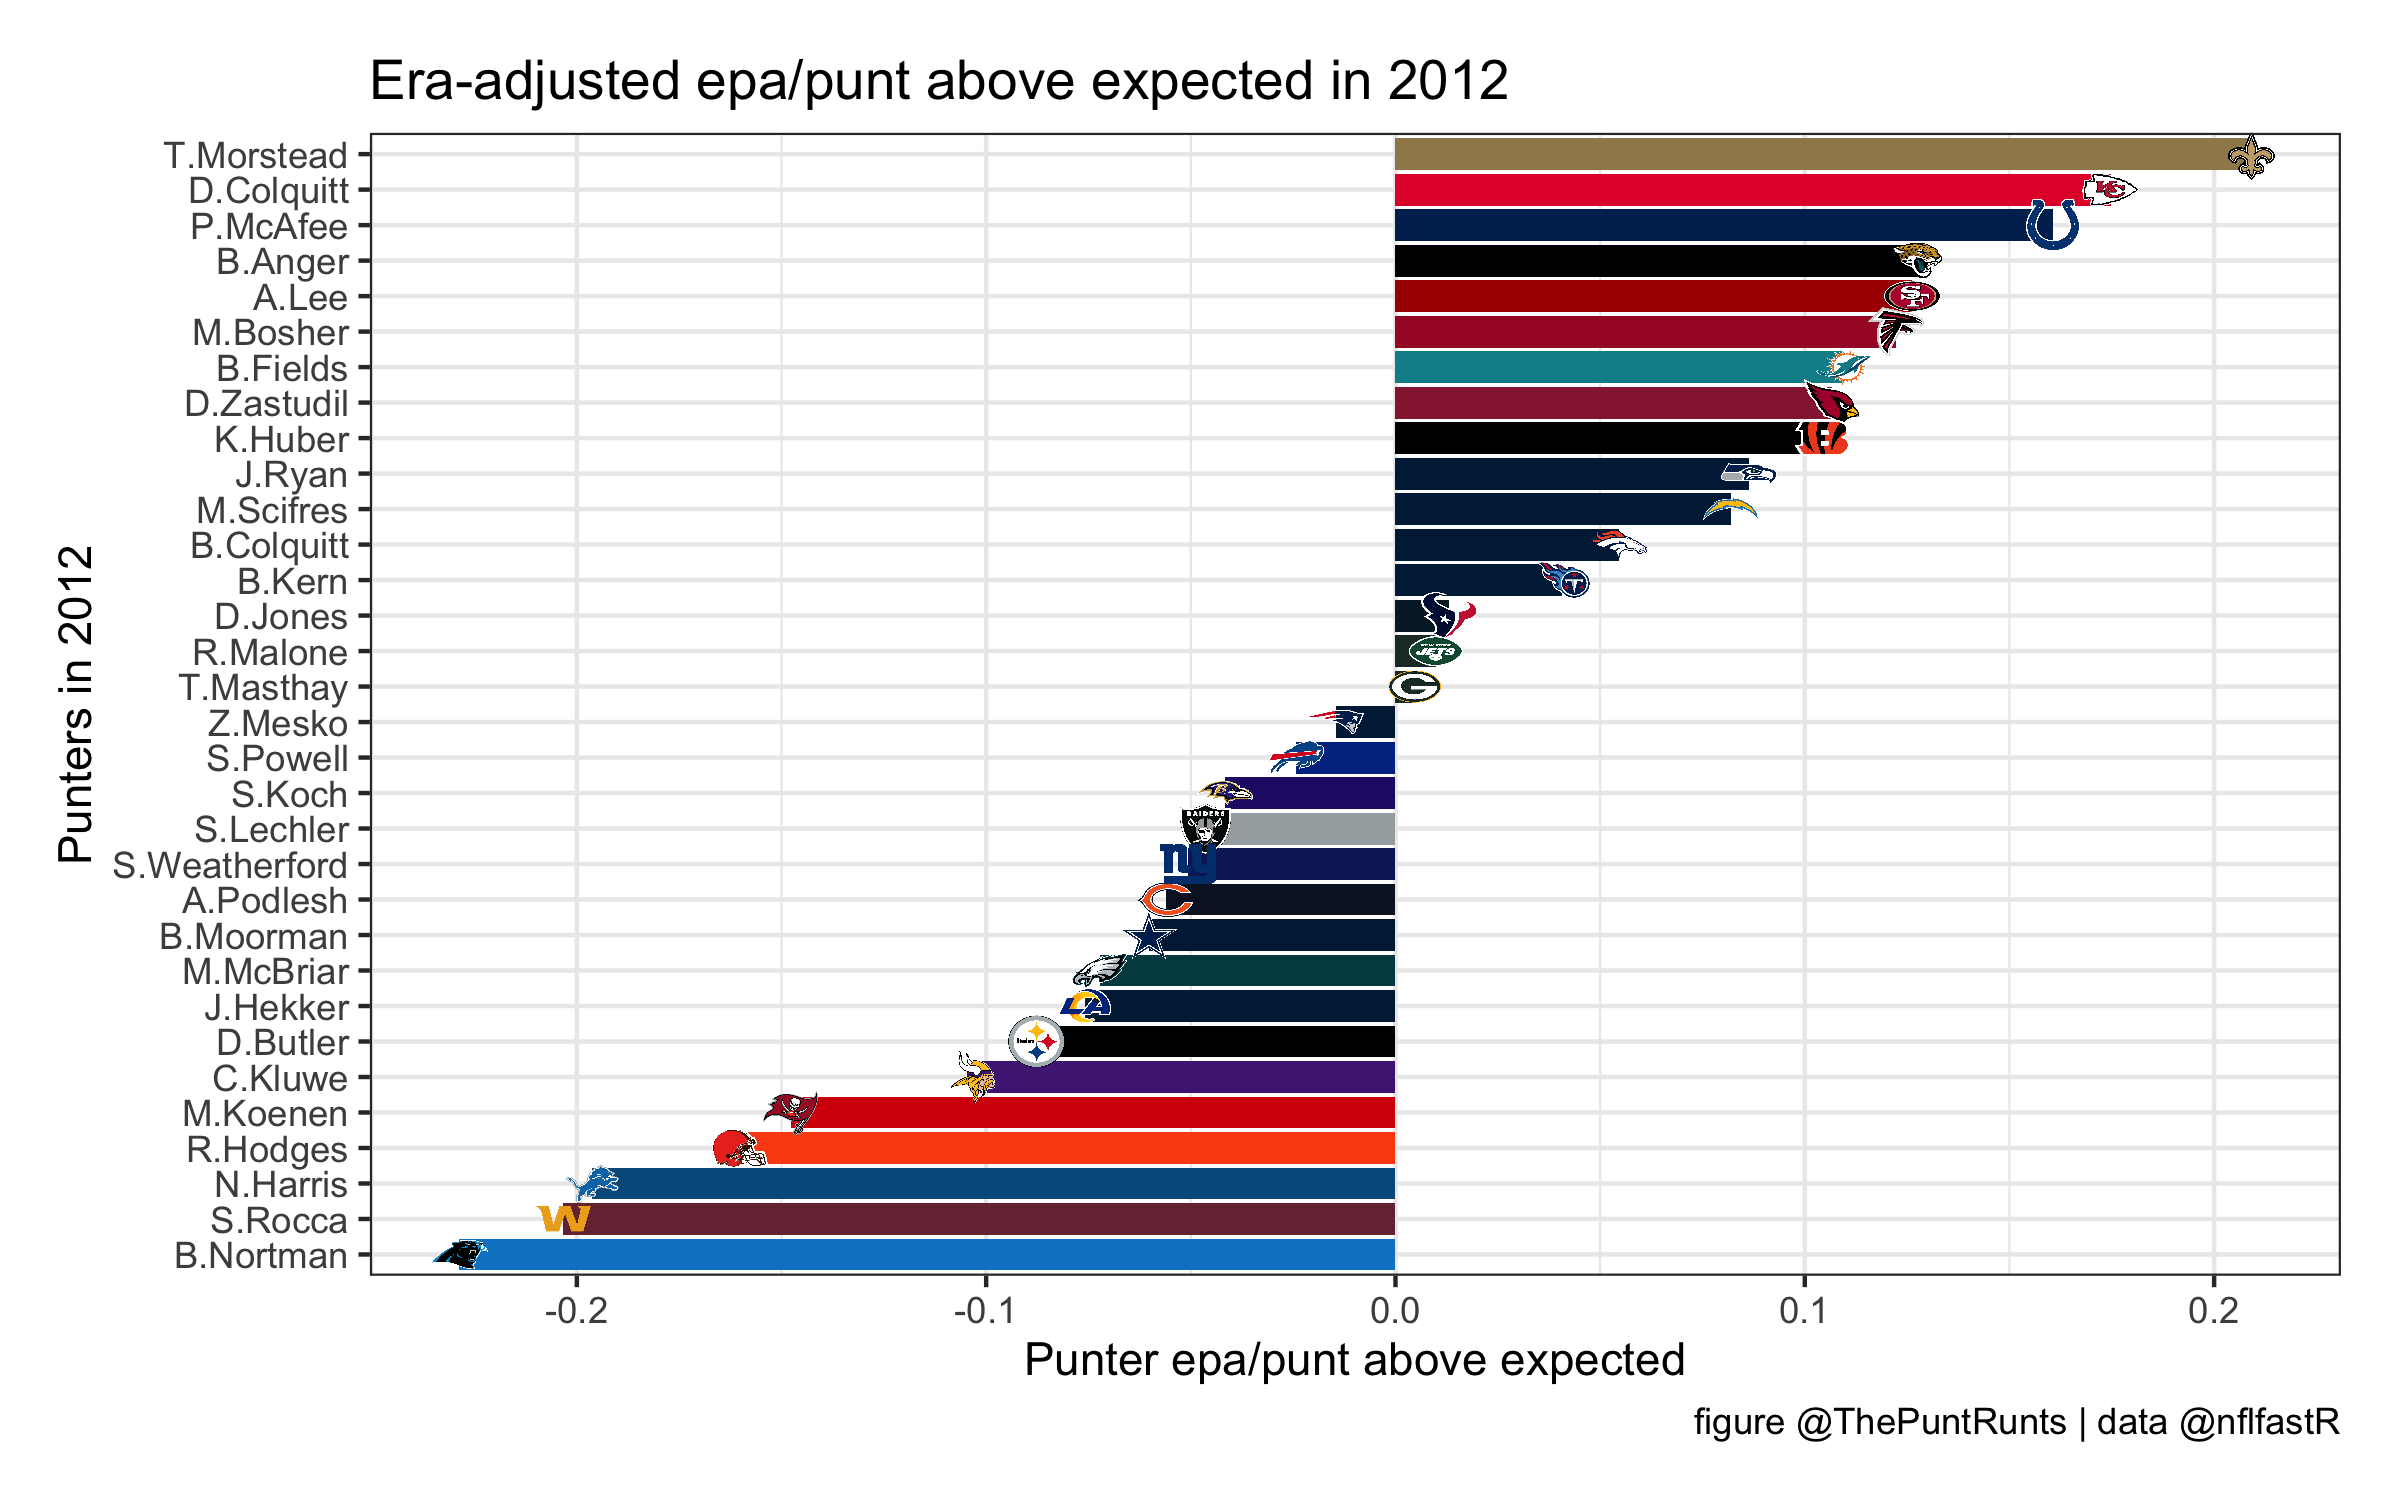
Stats from previous seasons
Punt Runts Custom EPA
How has your favorite punter stacked up in EPA over the years?
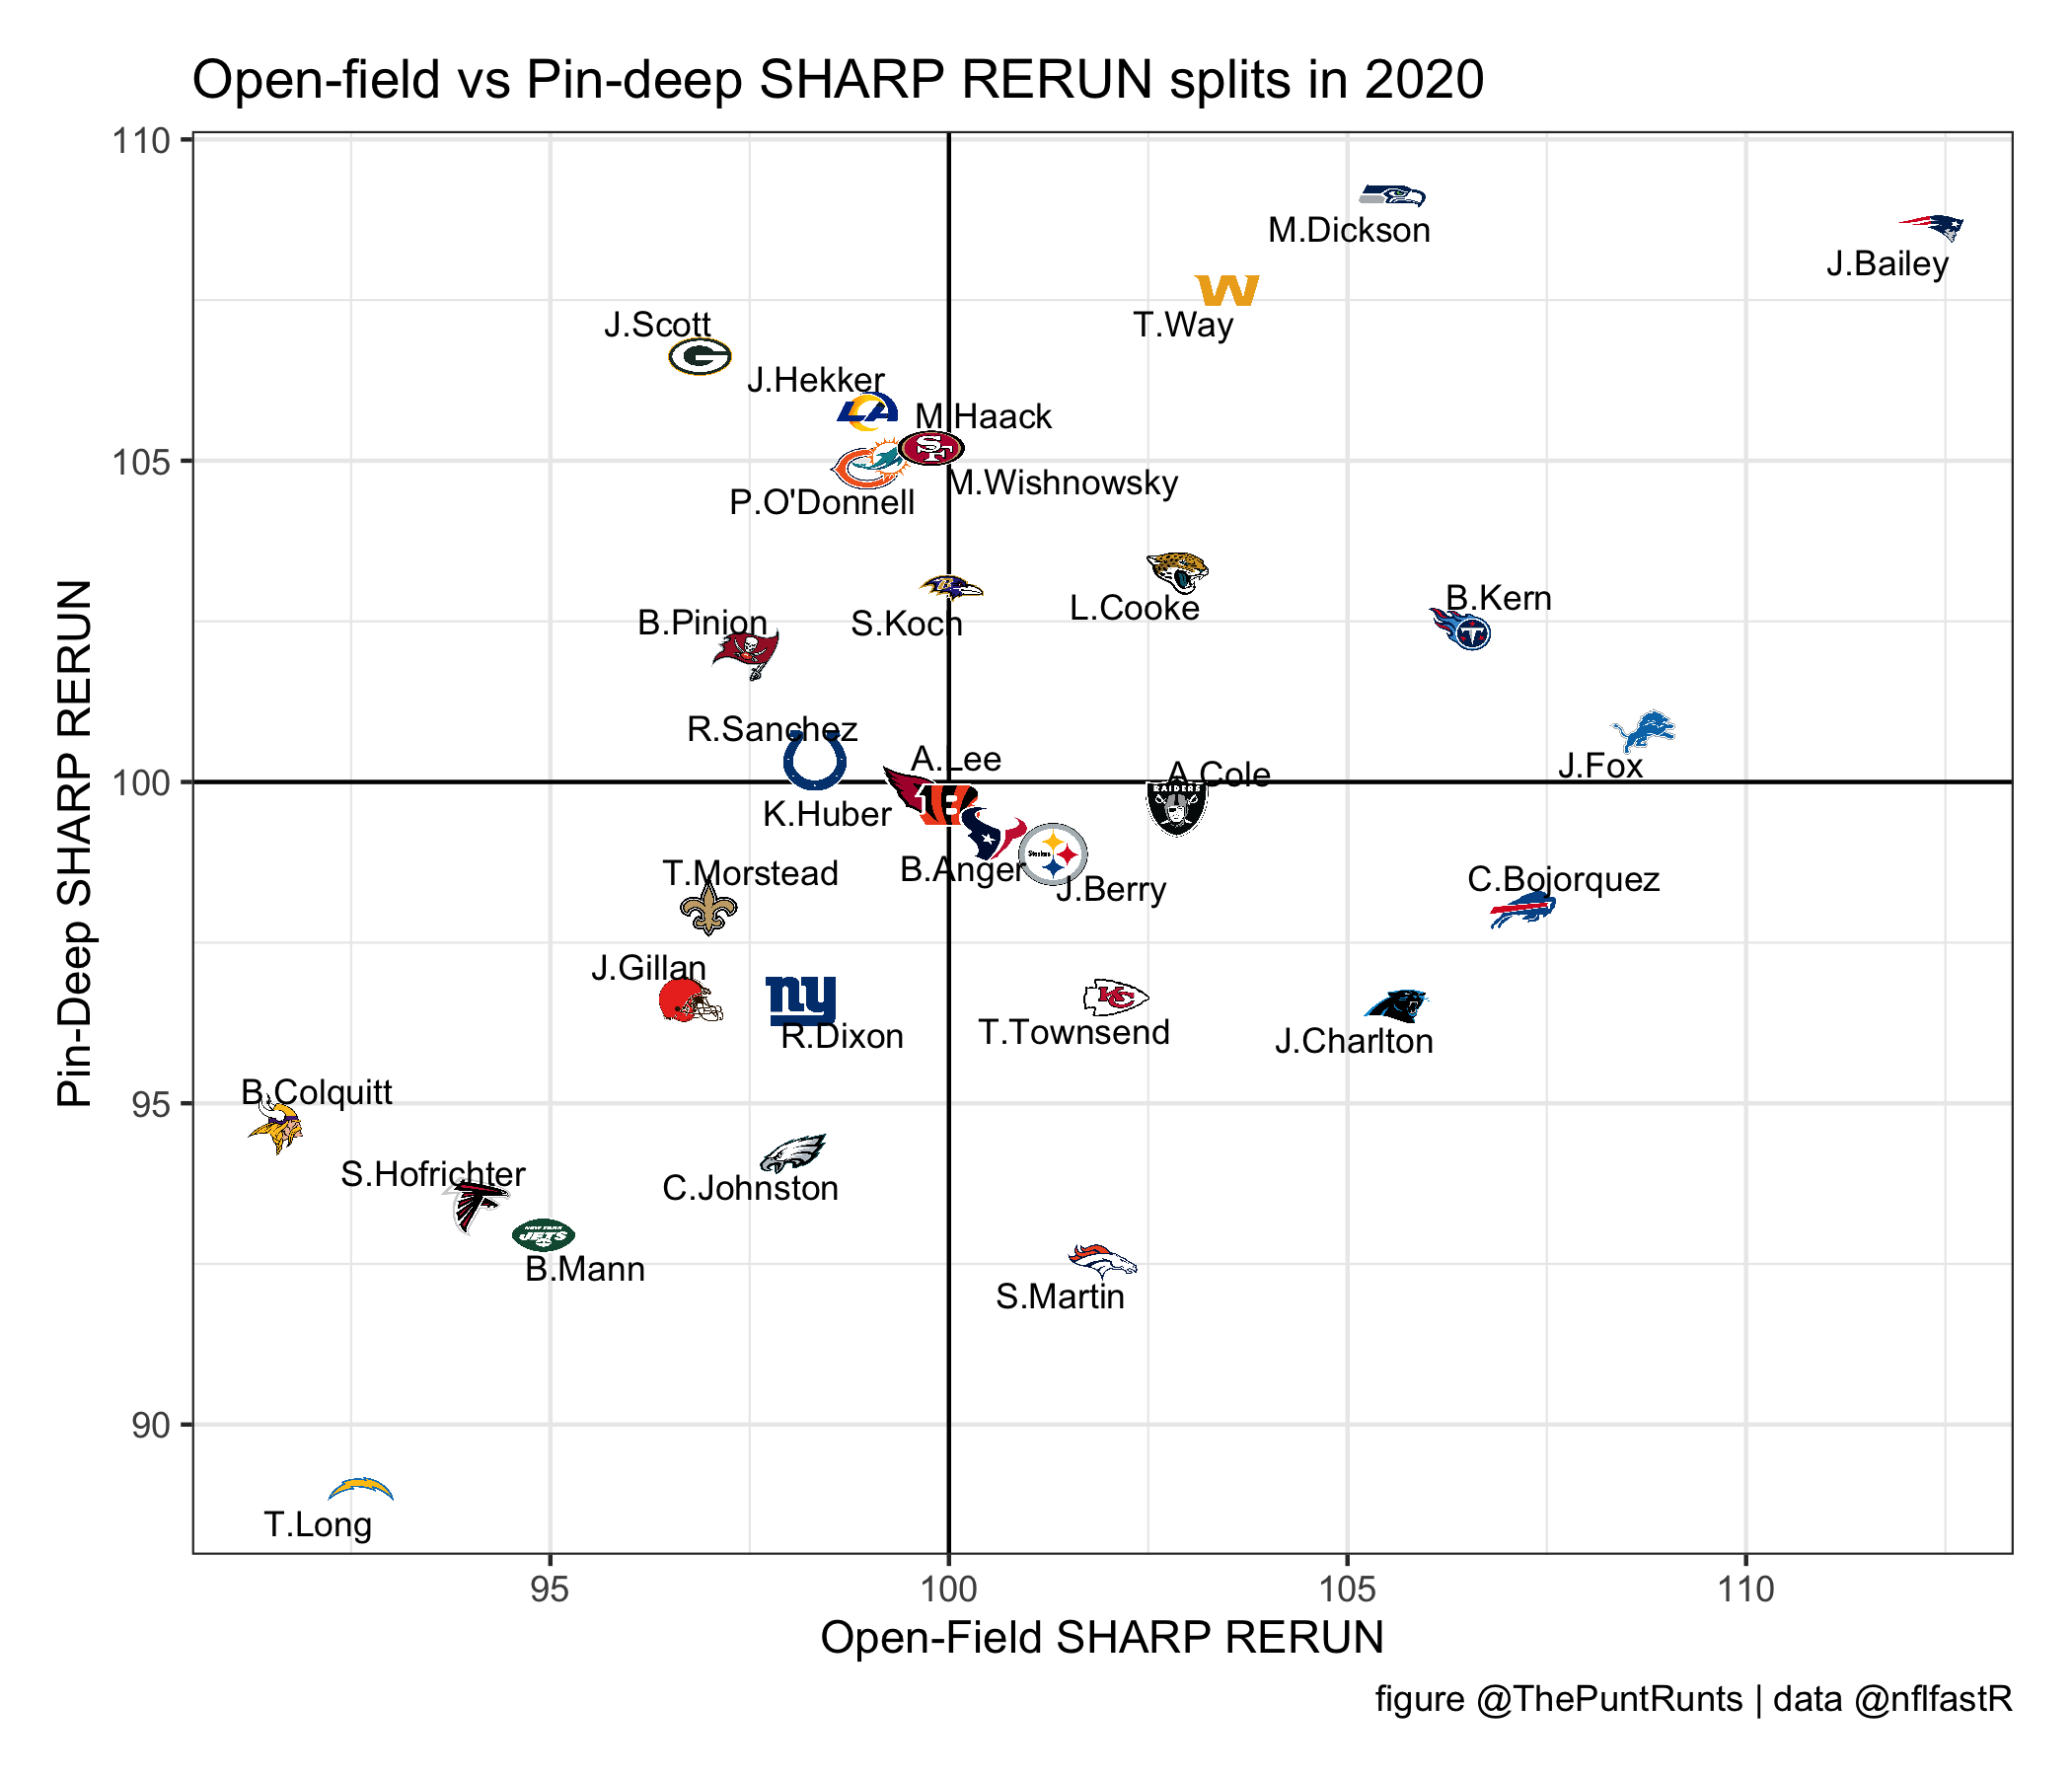
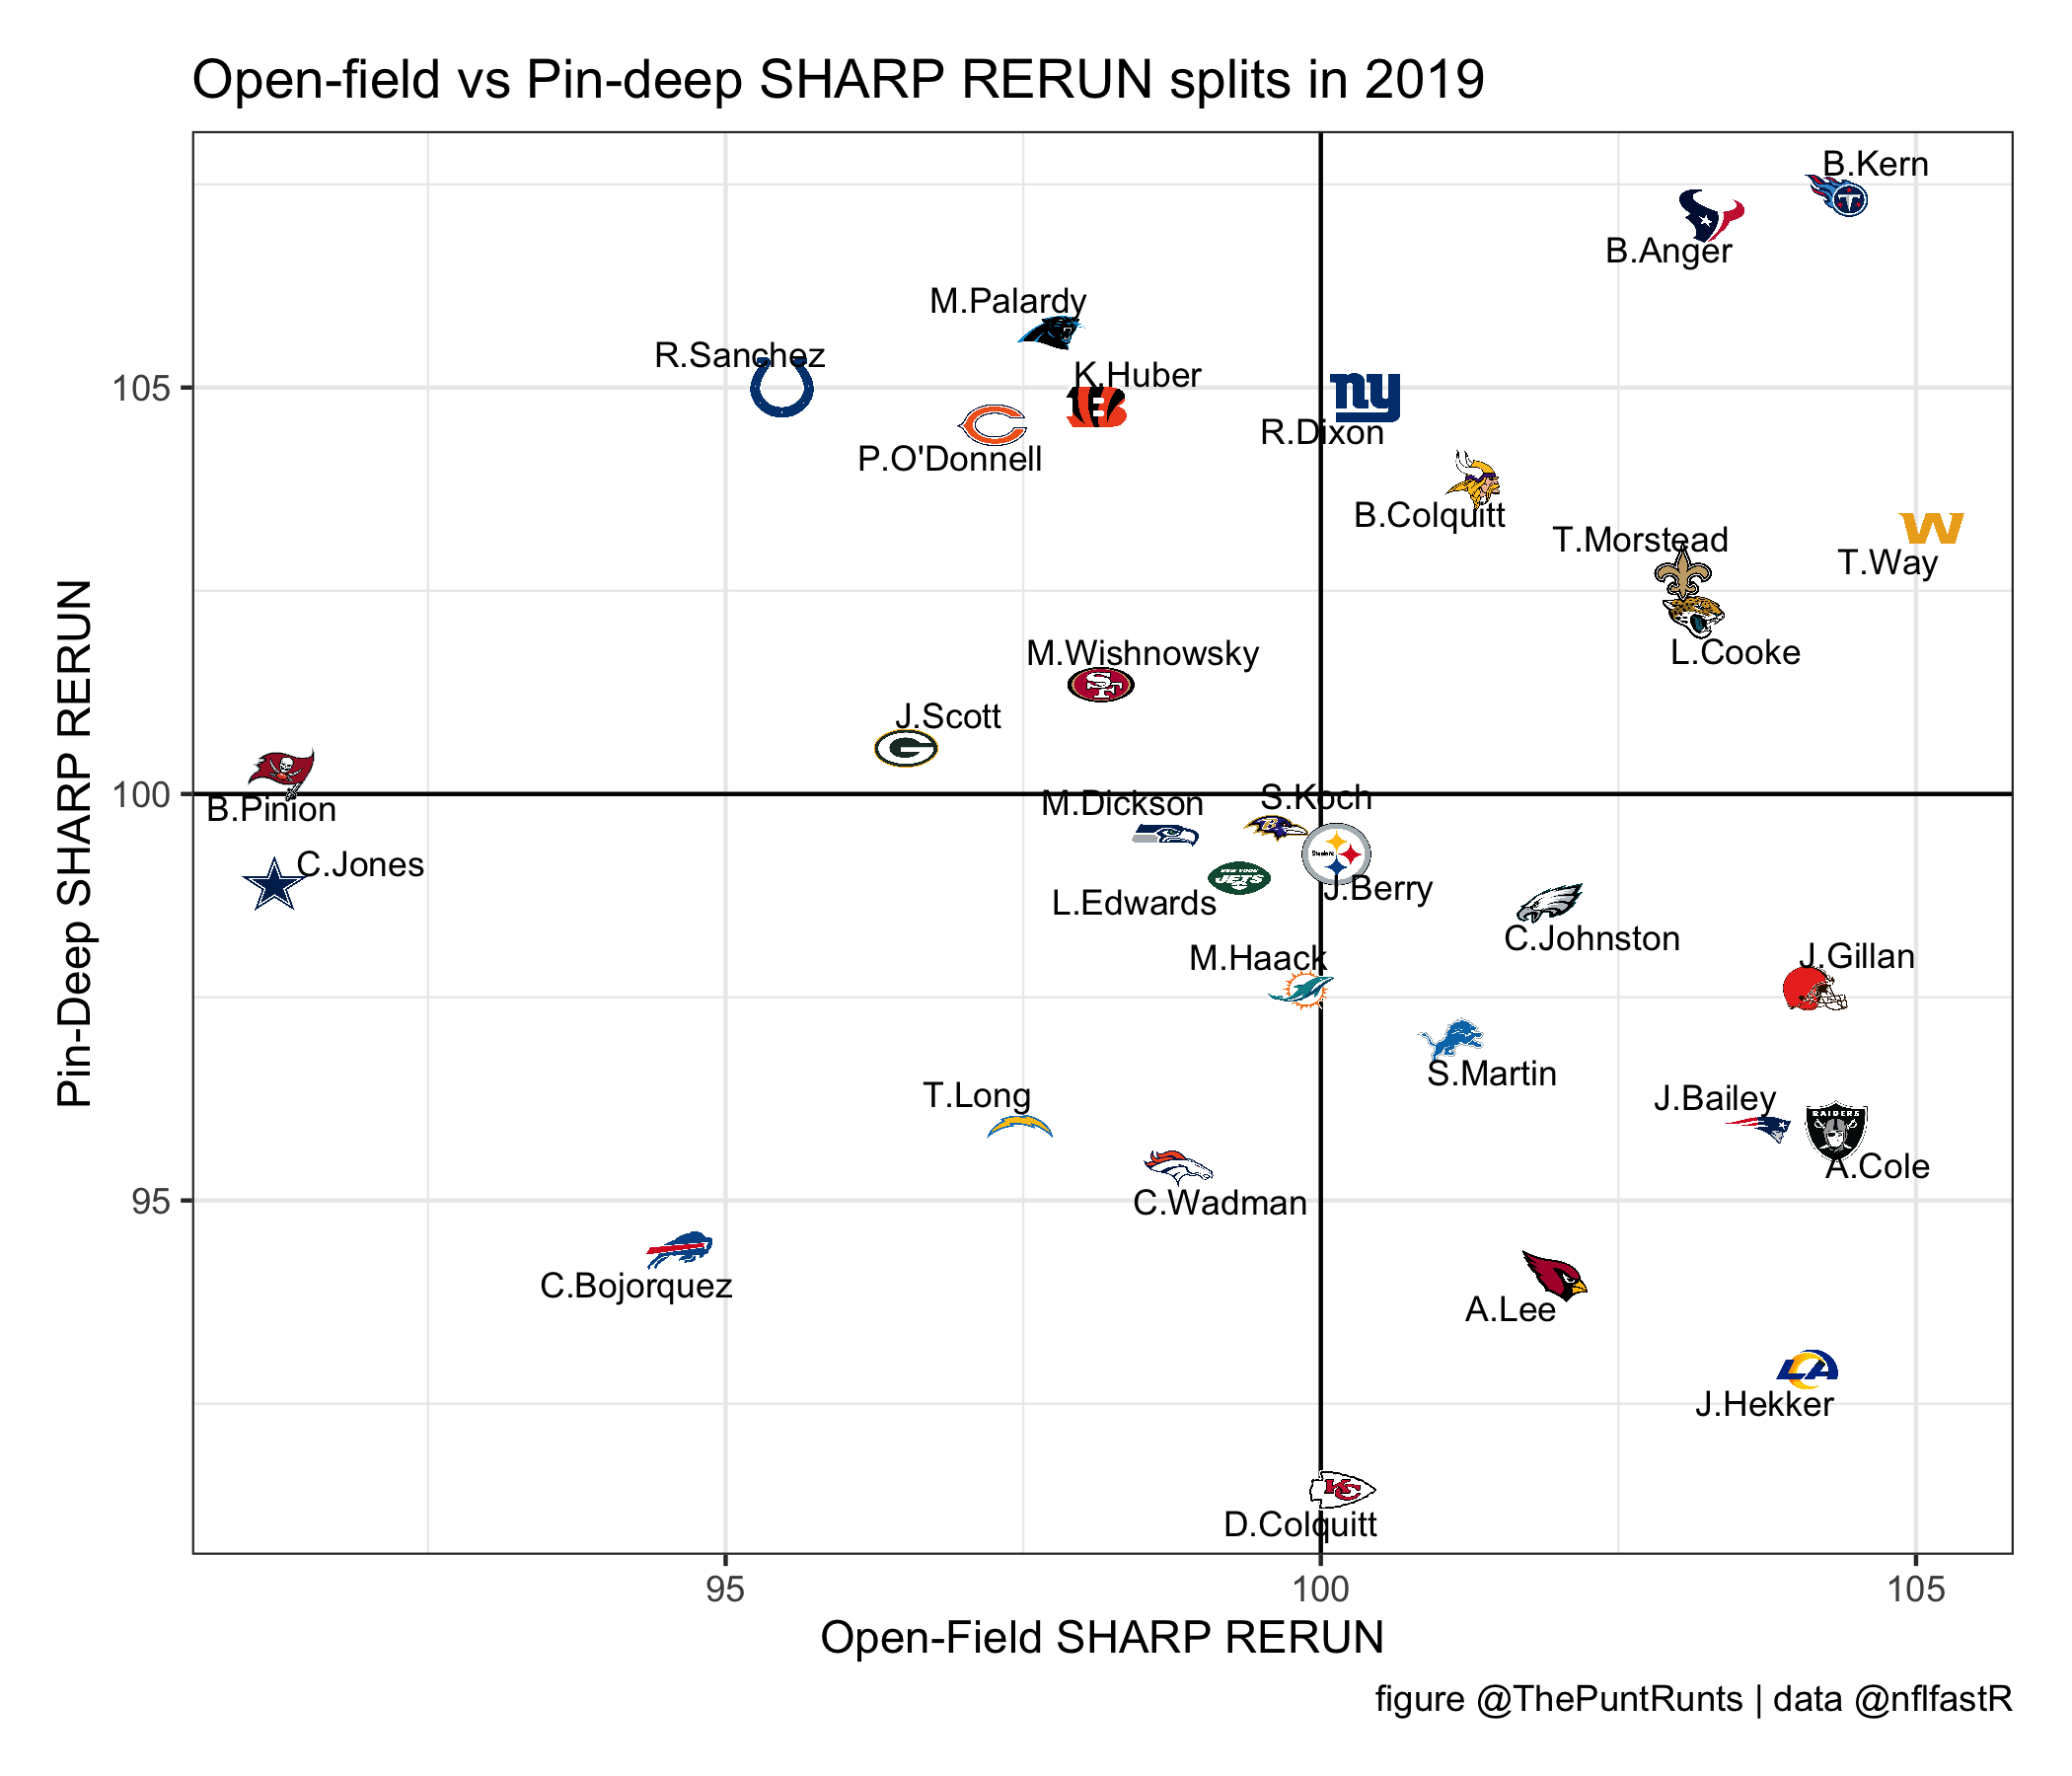
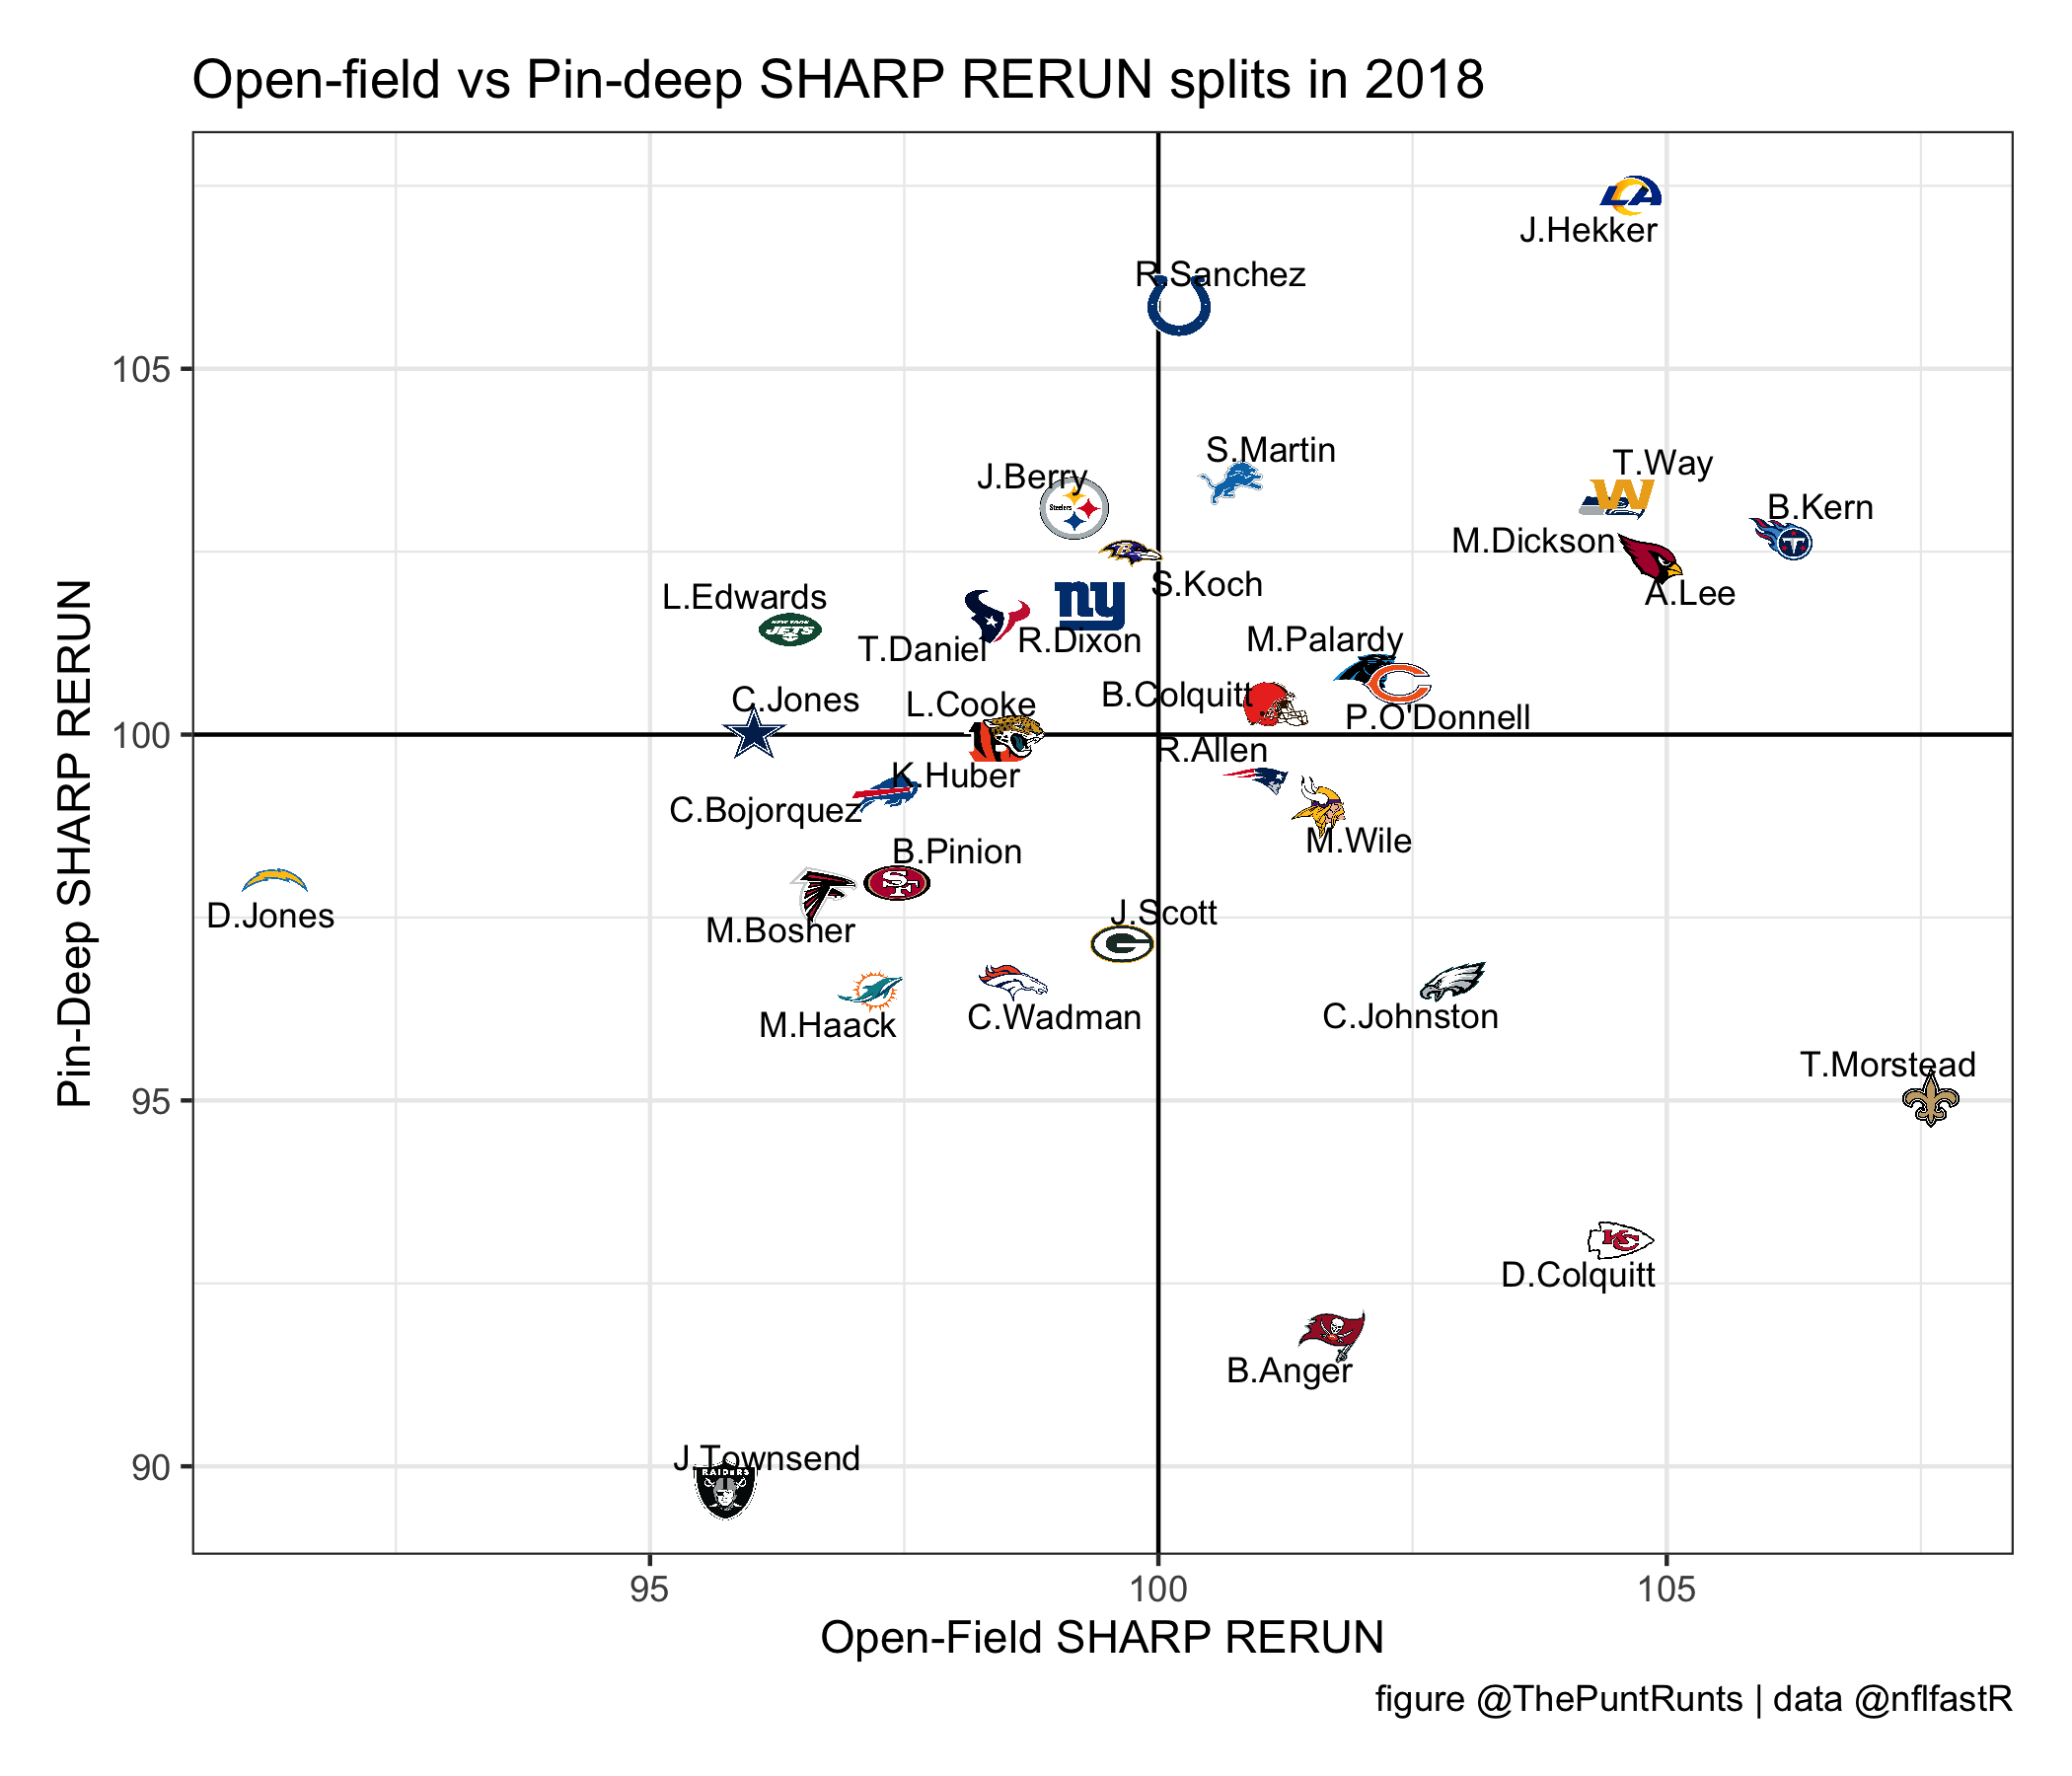
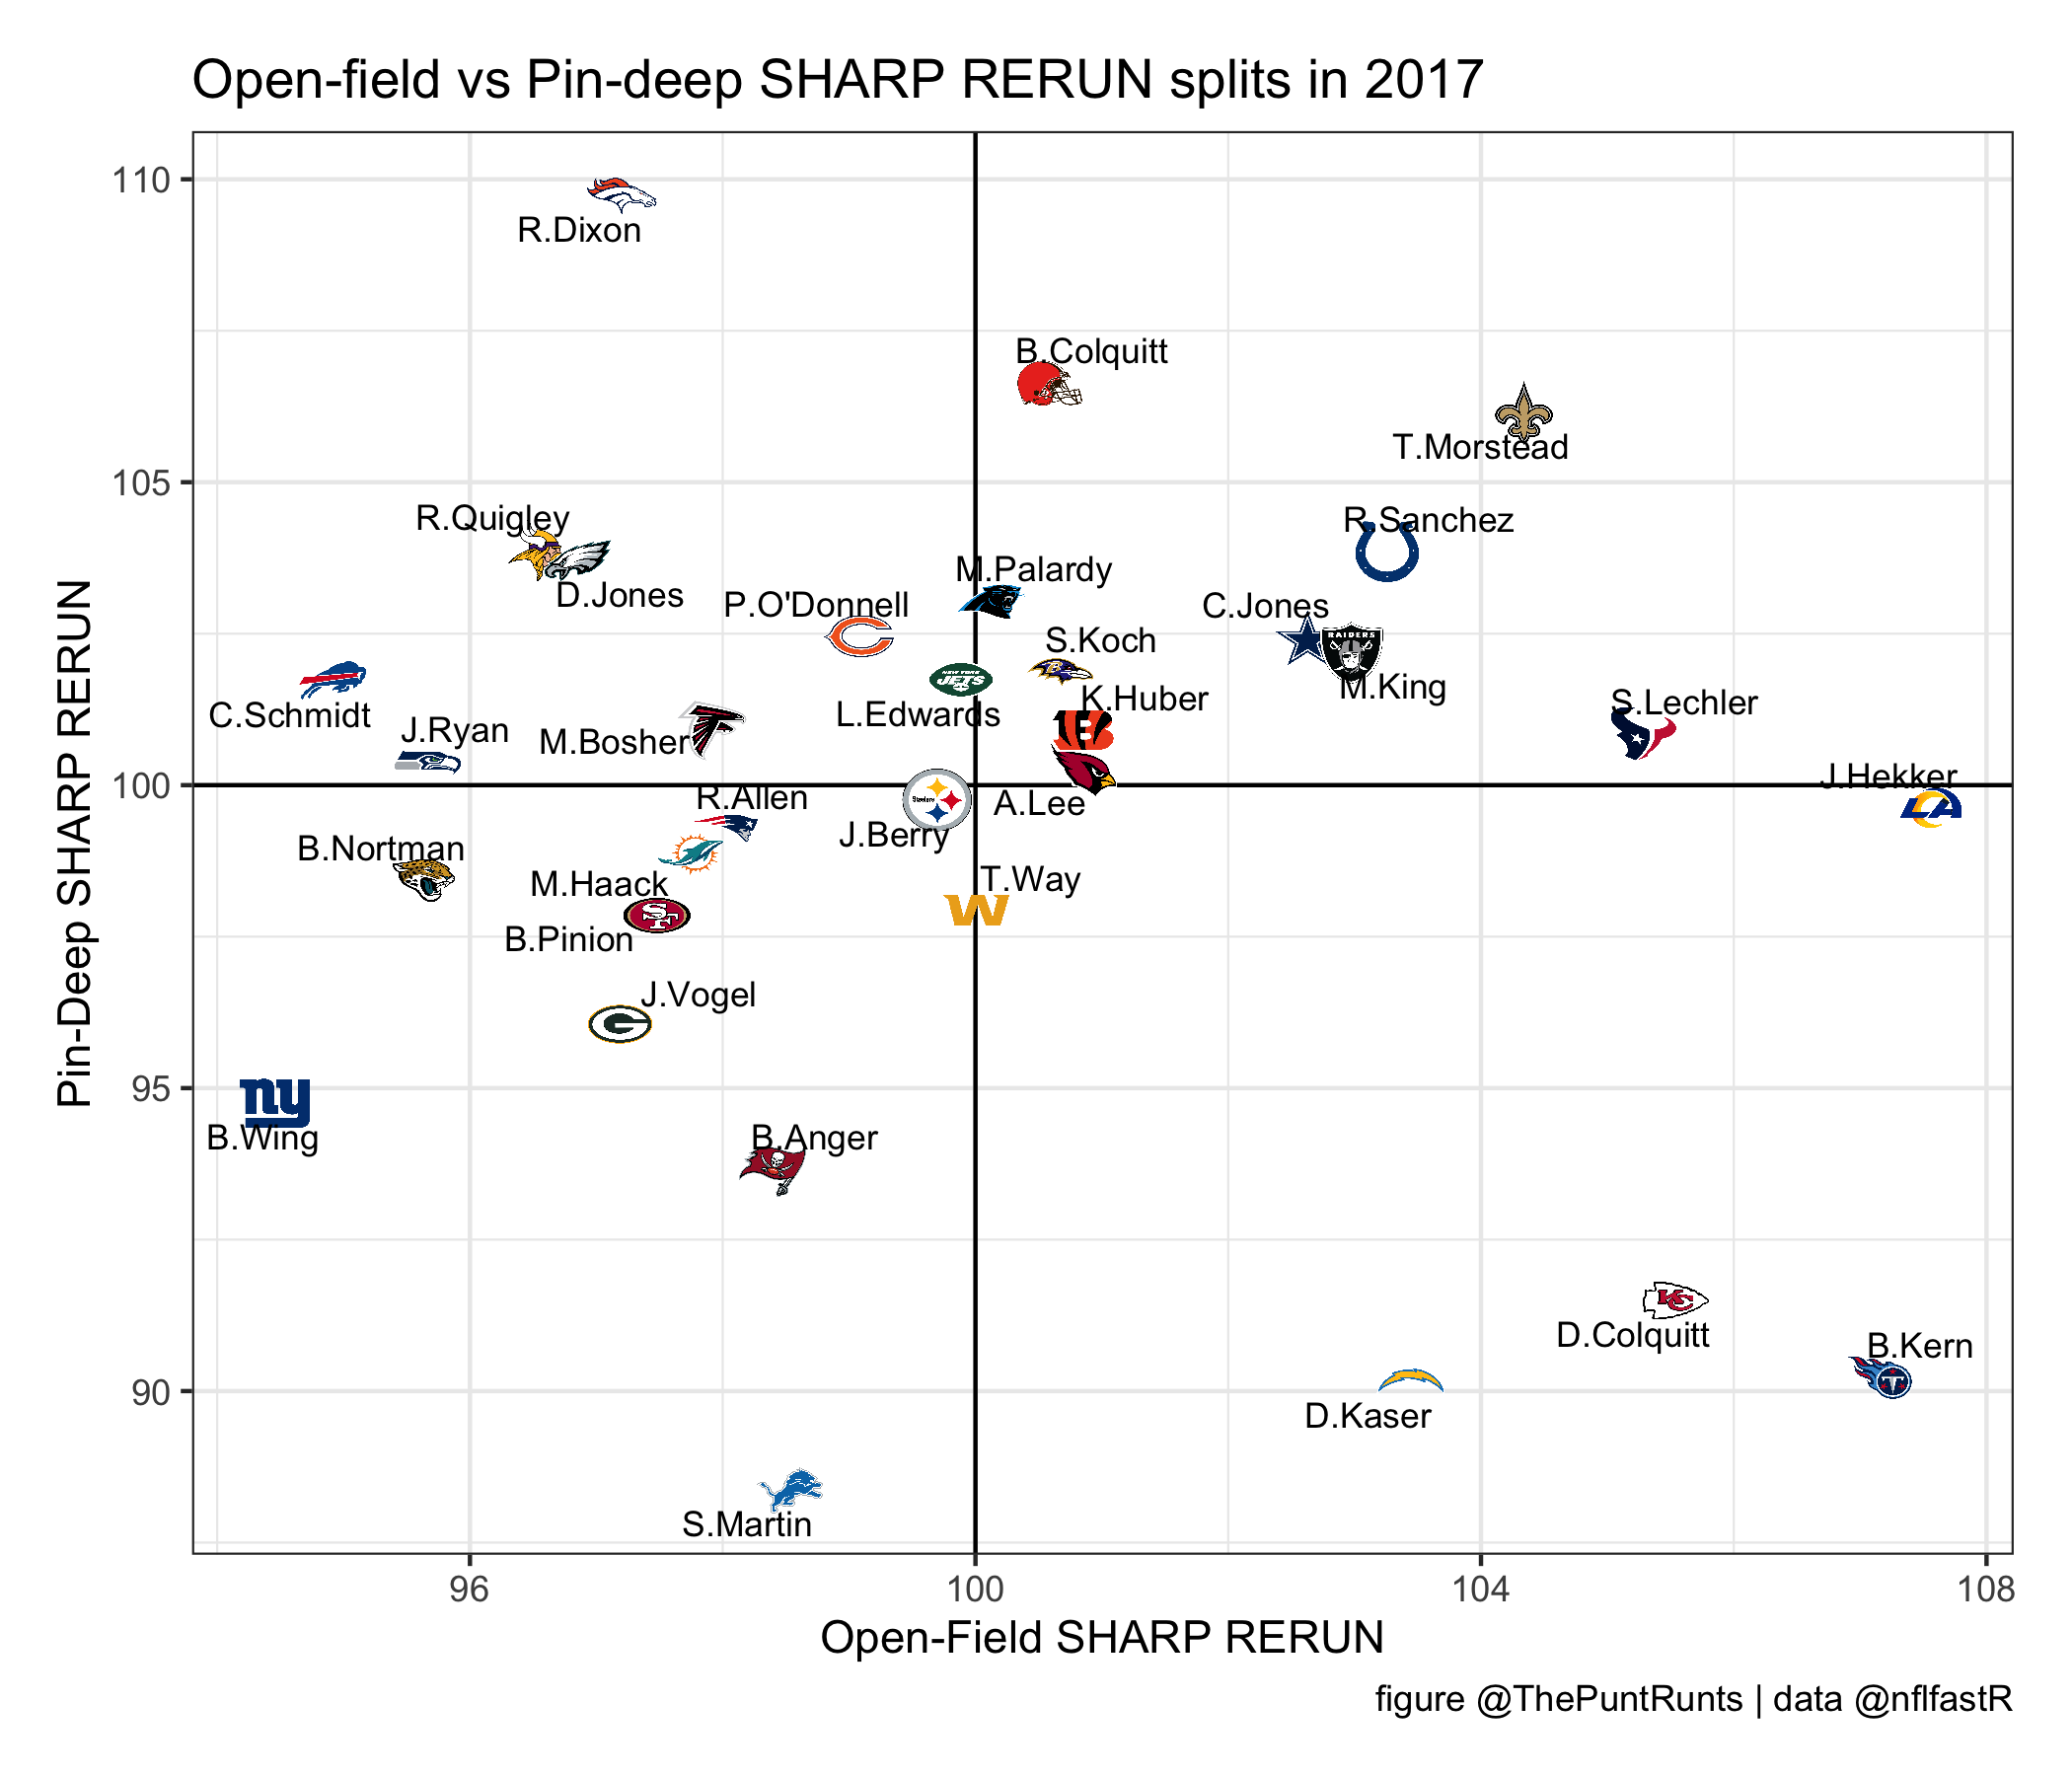
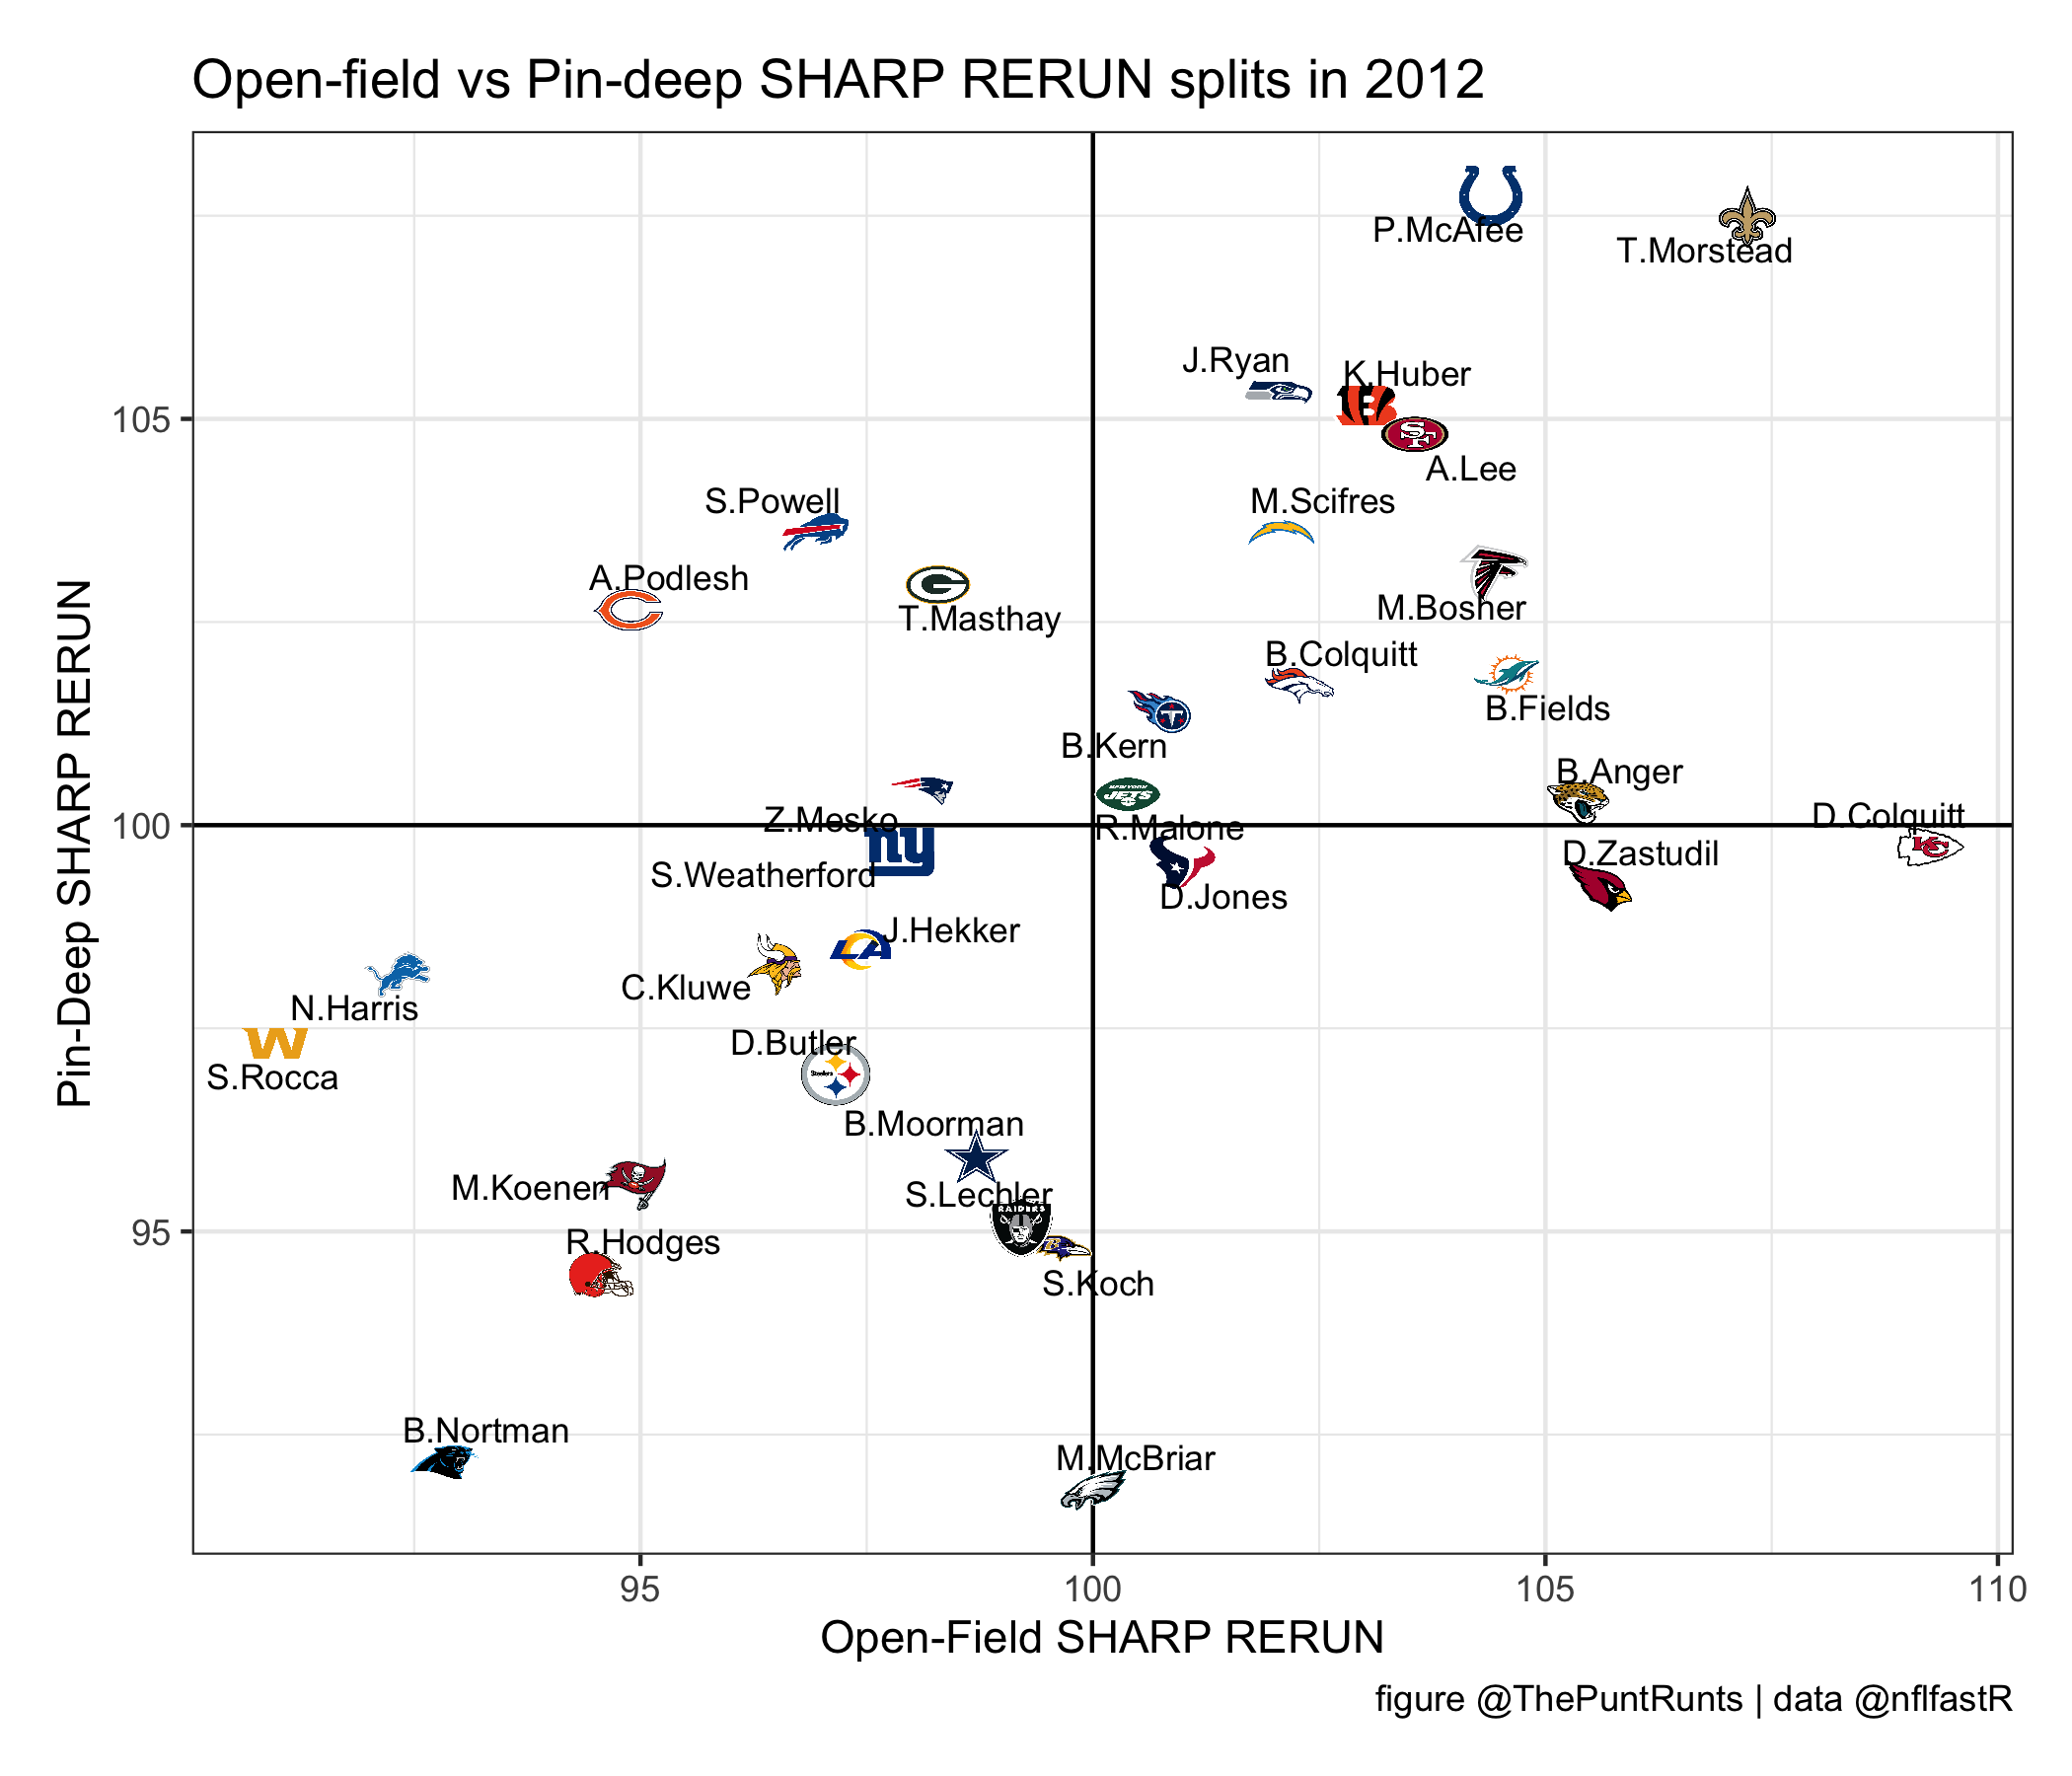
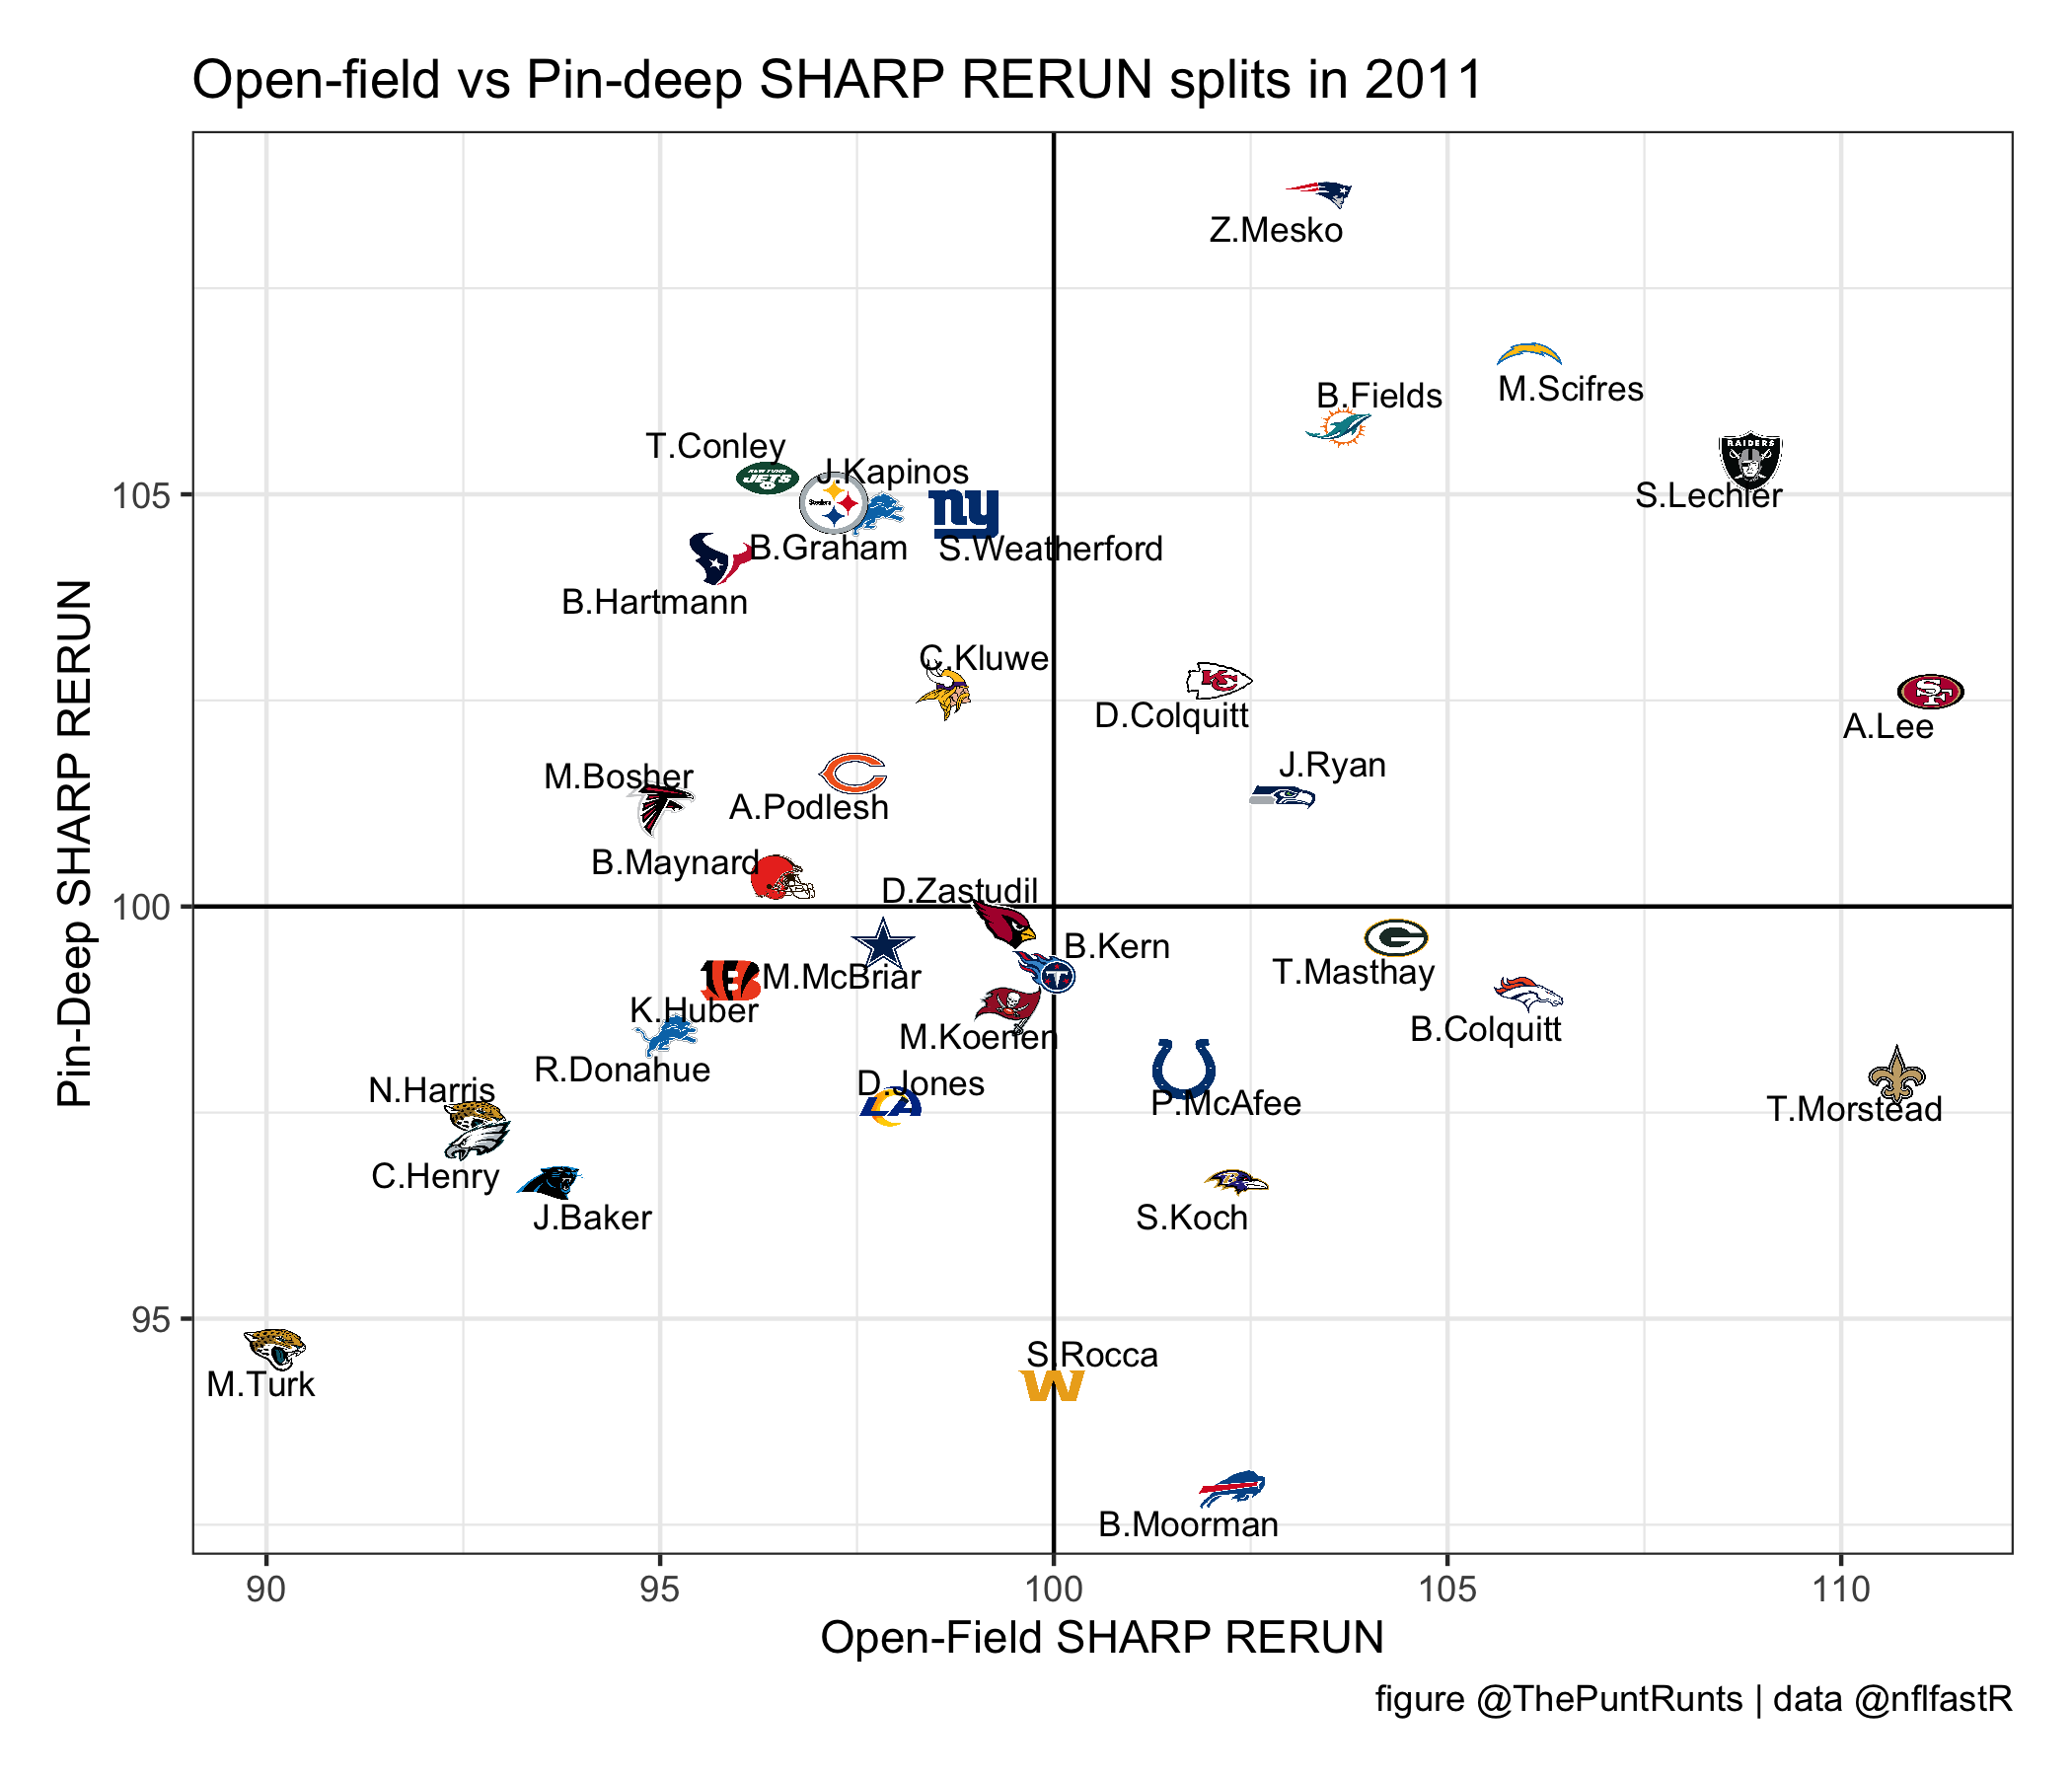
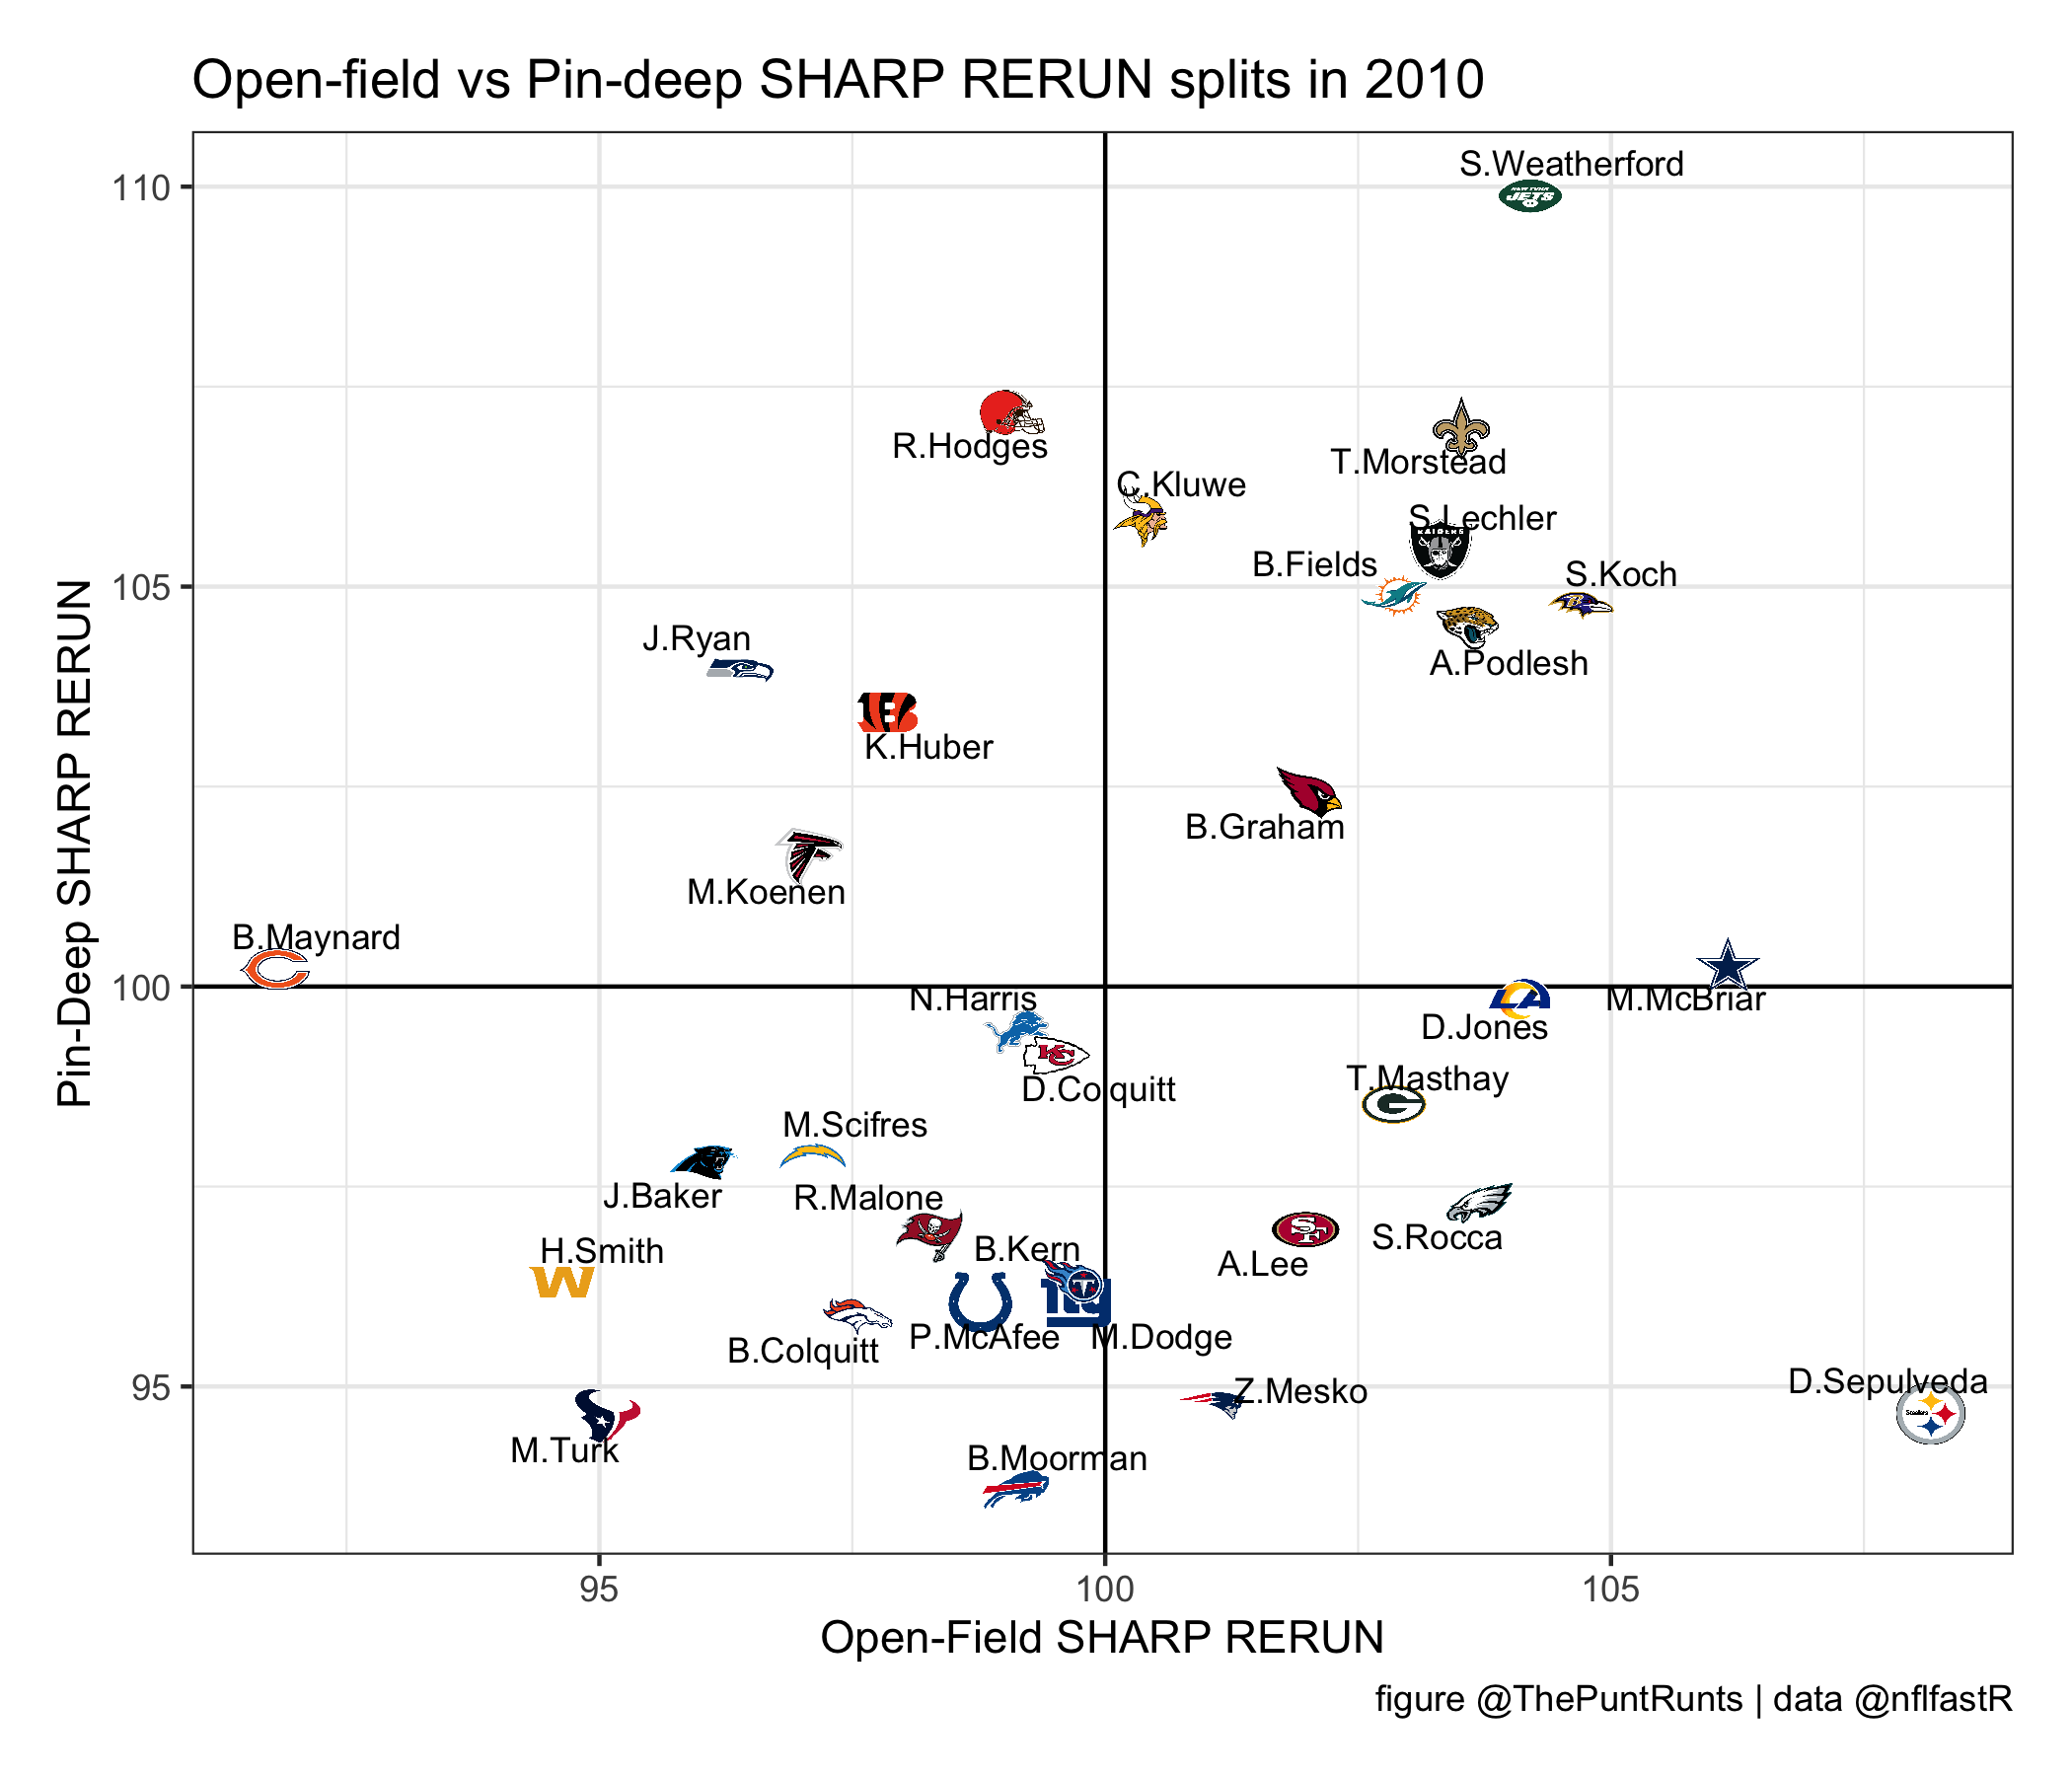
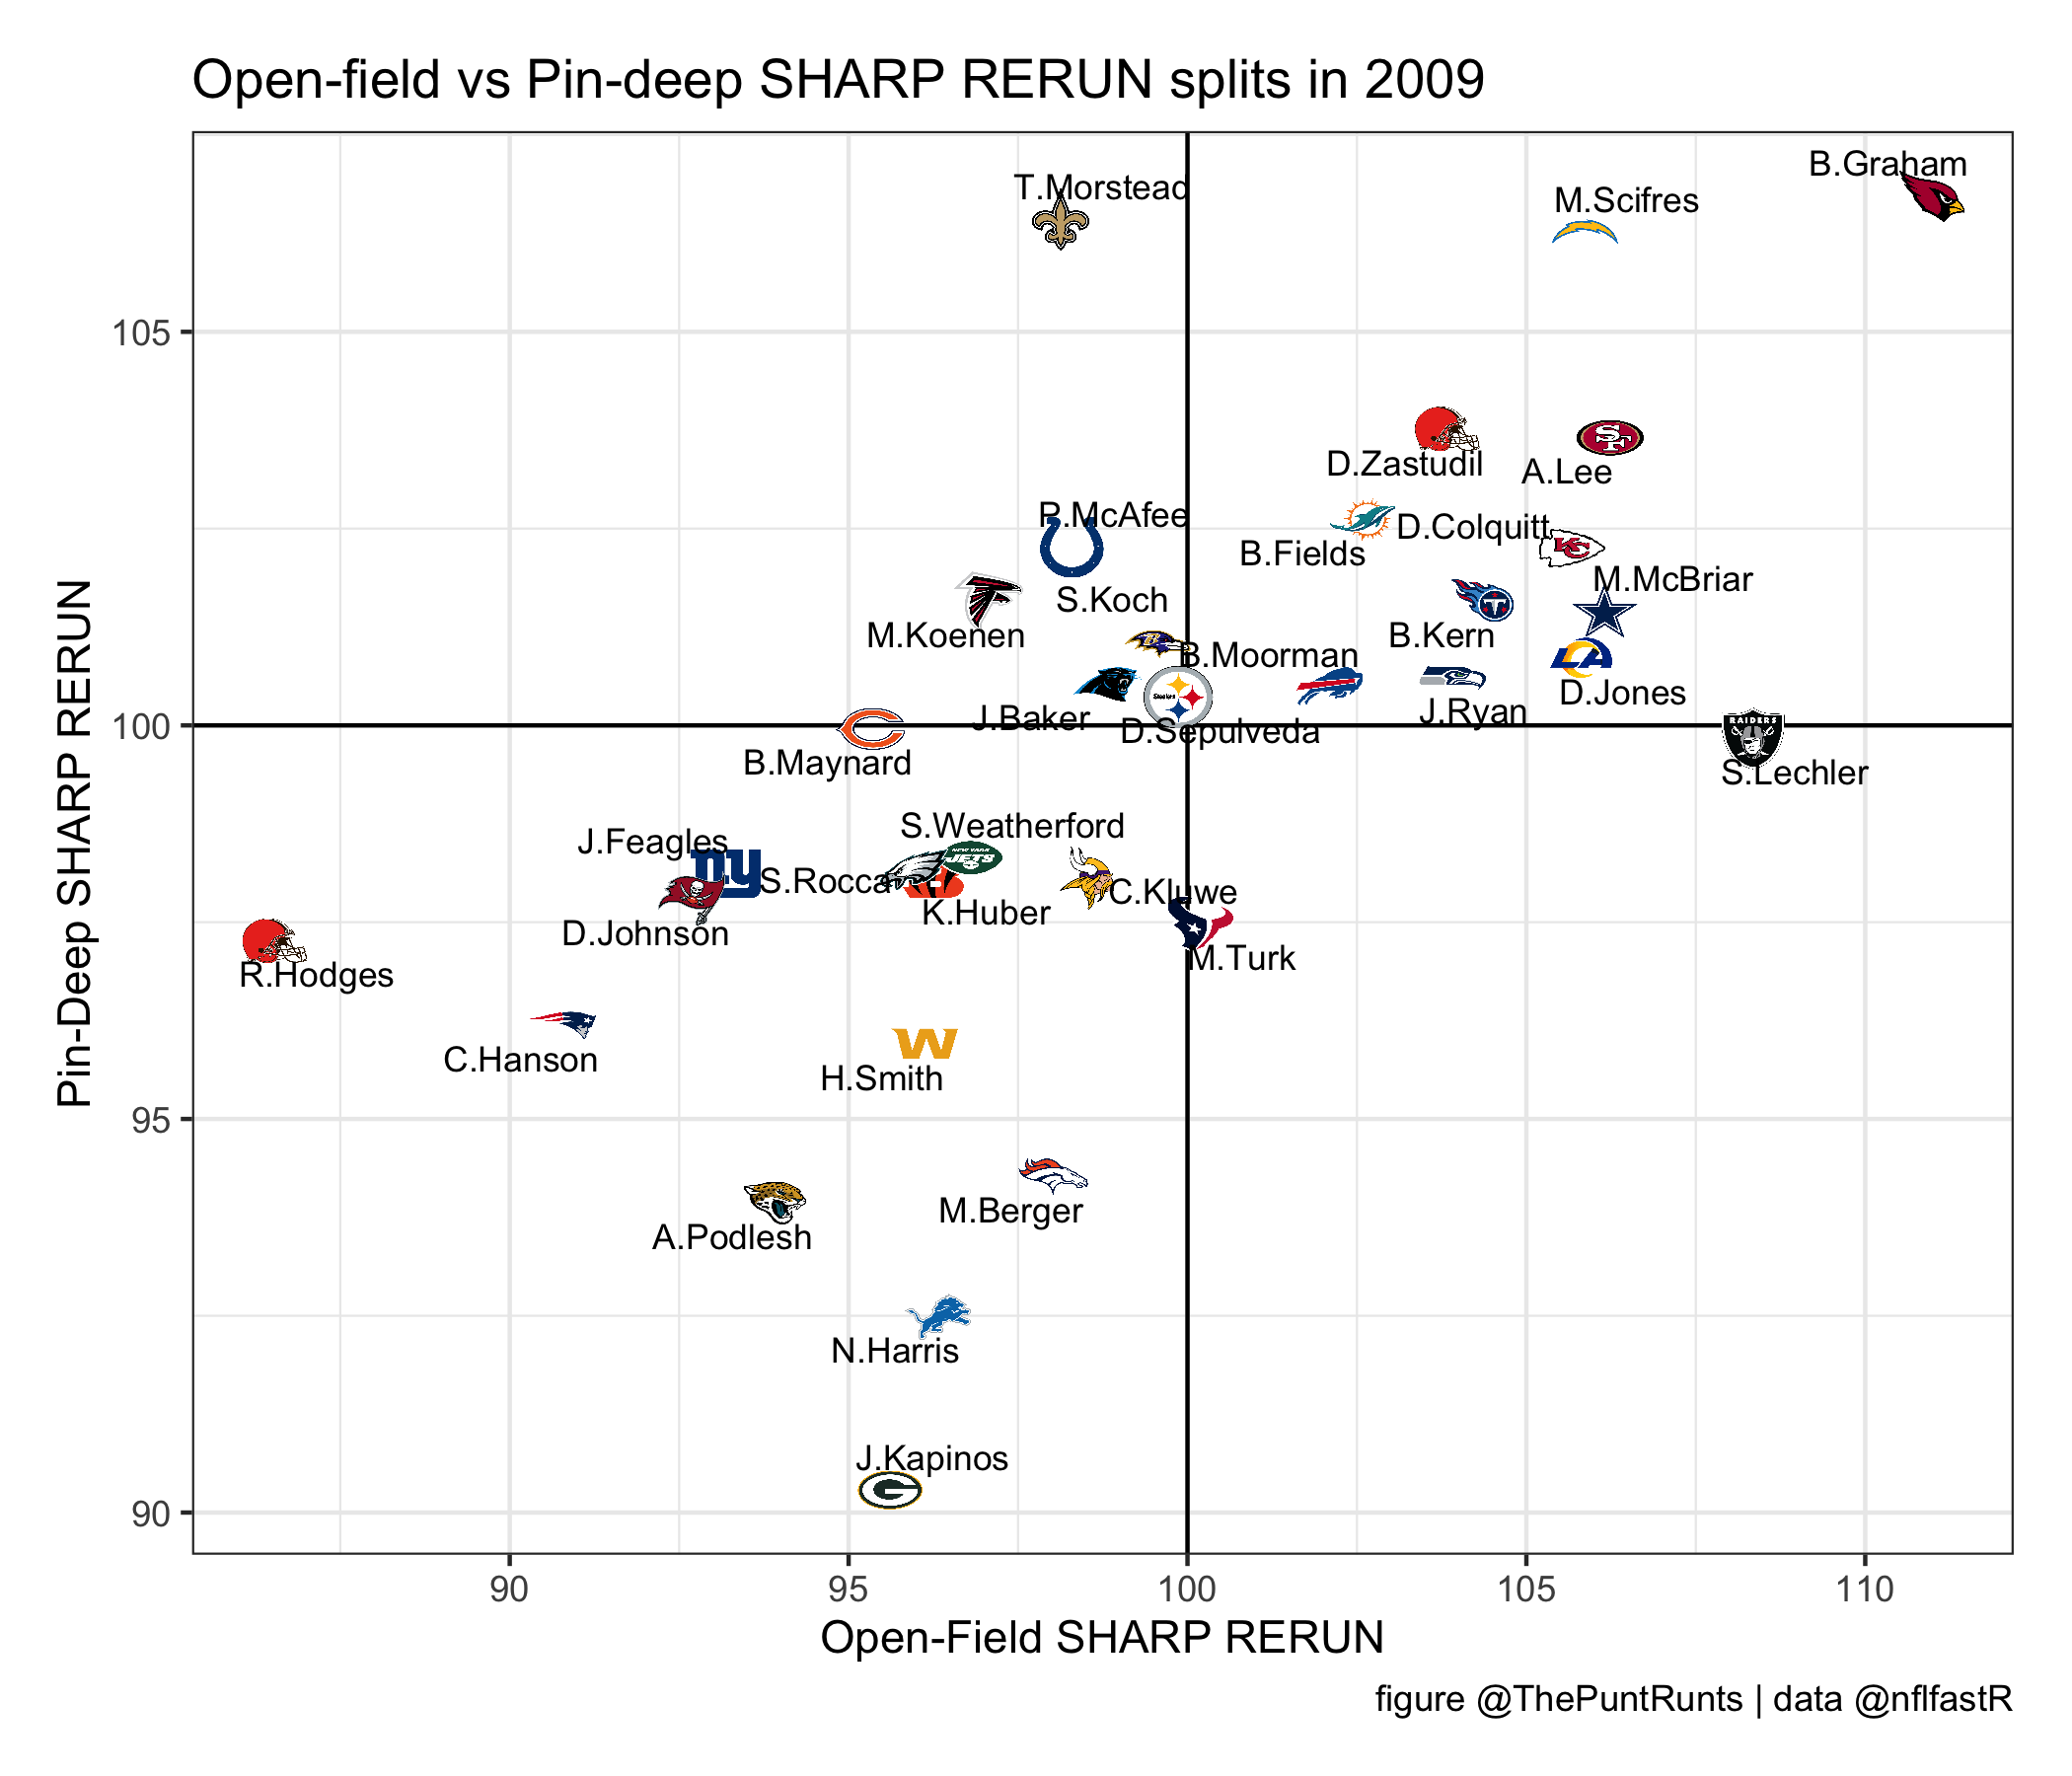
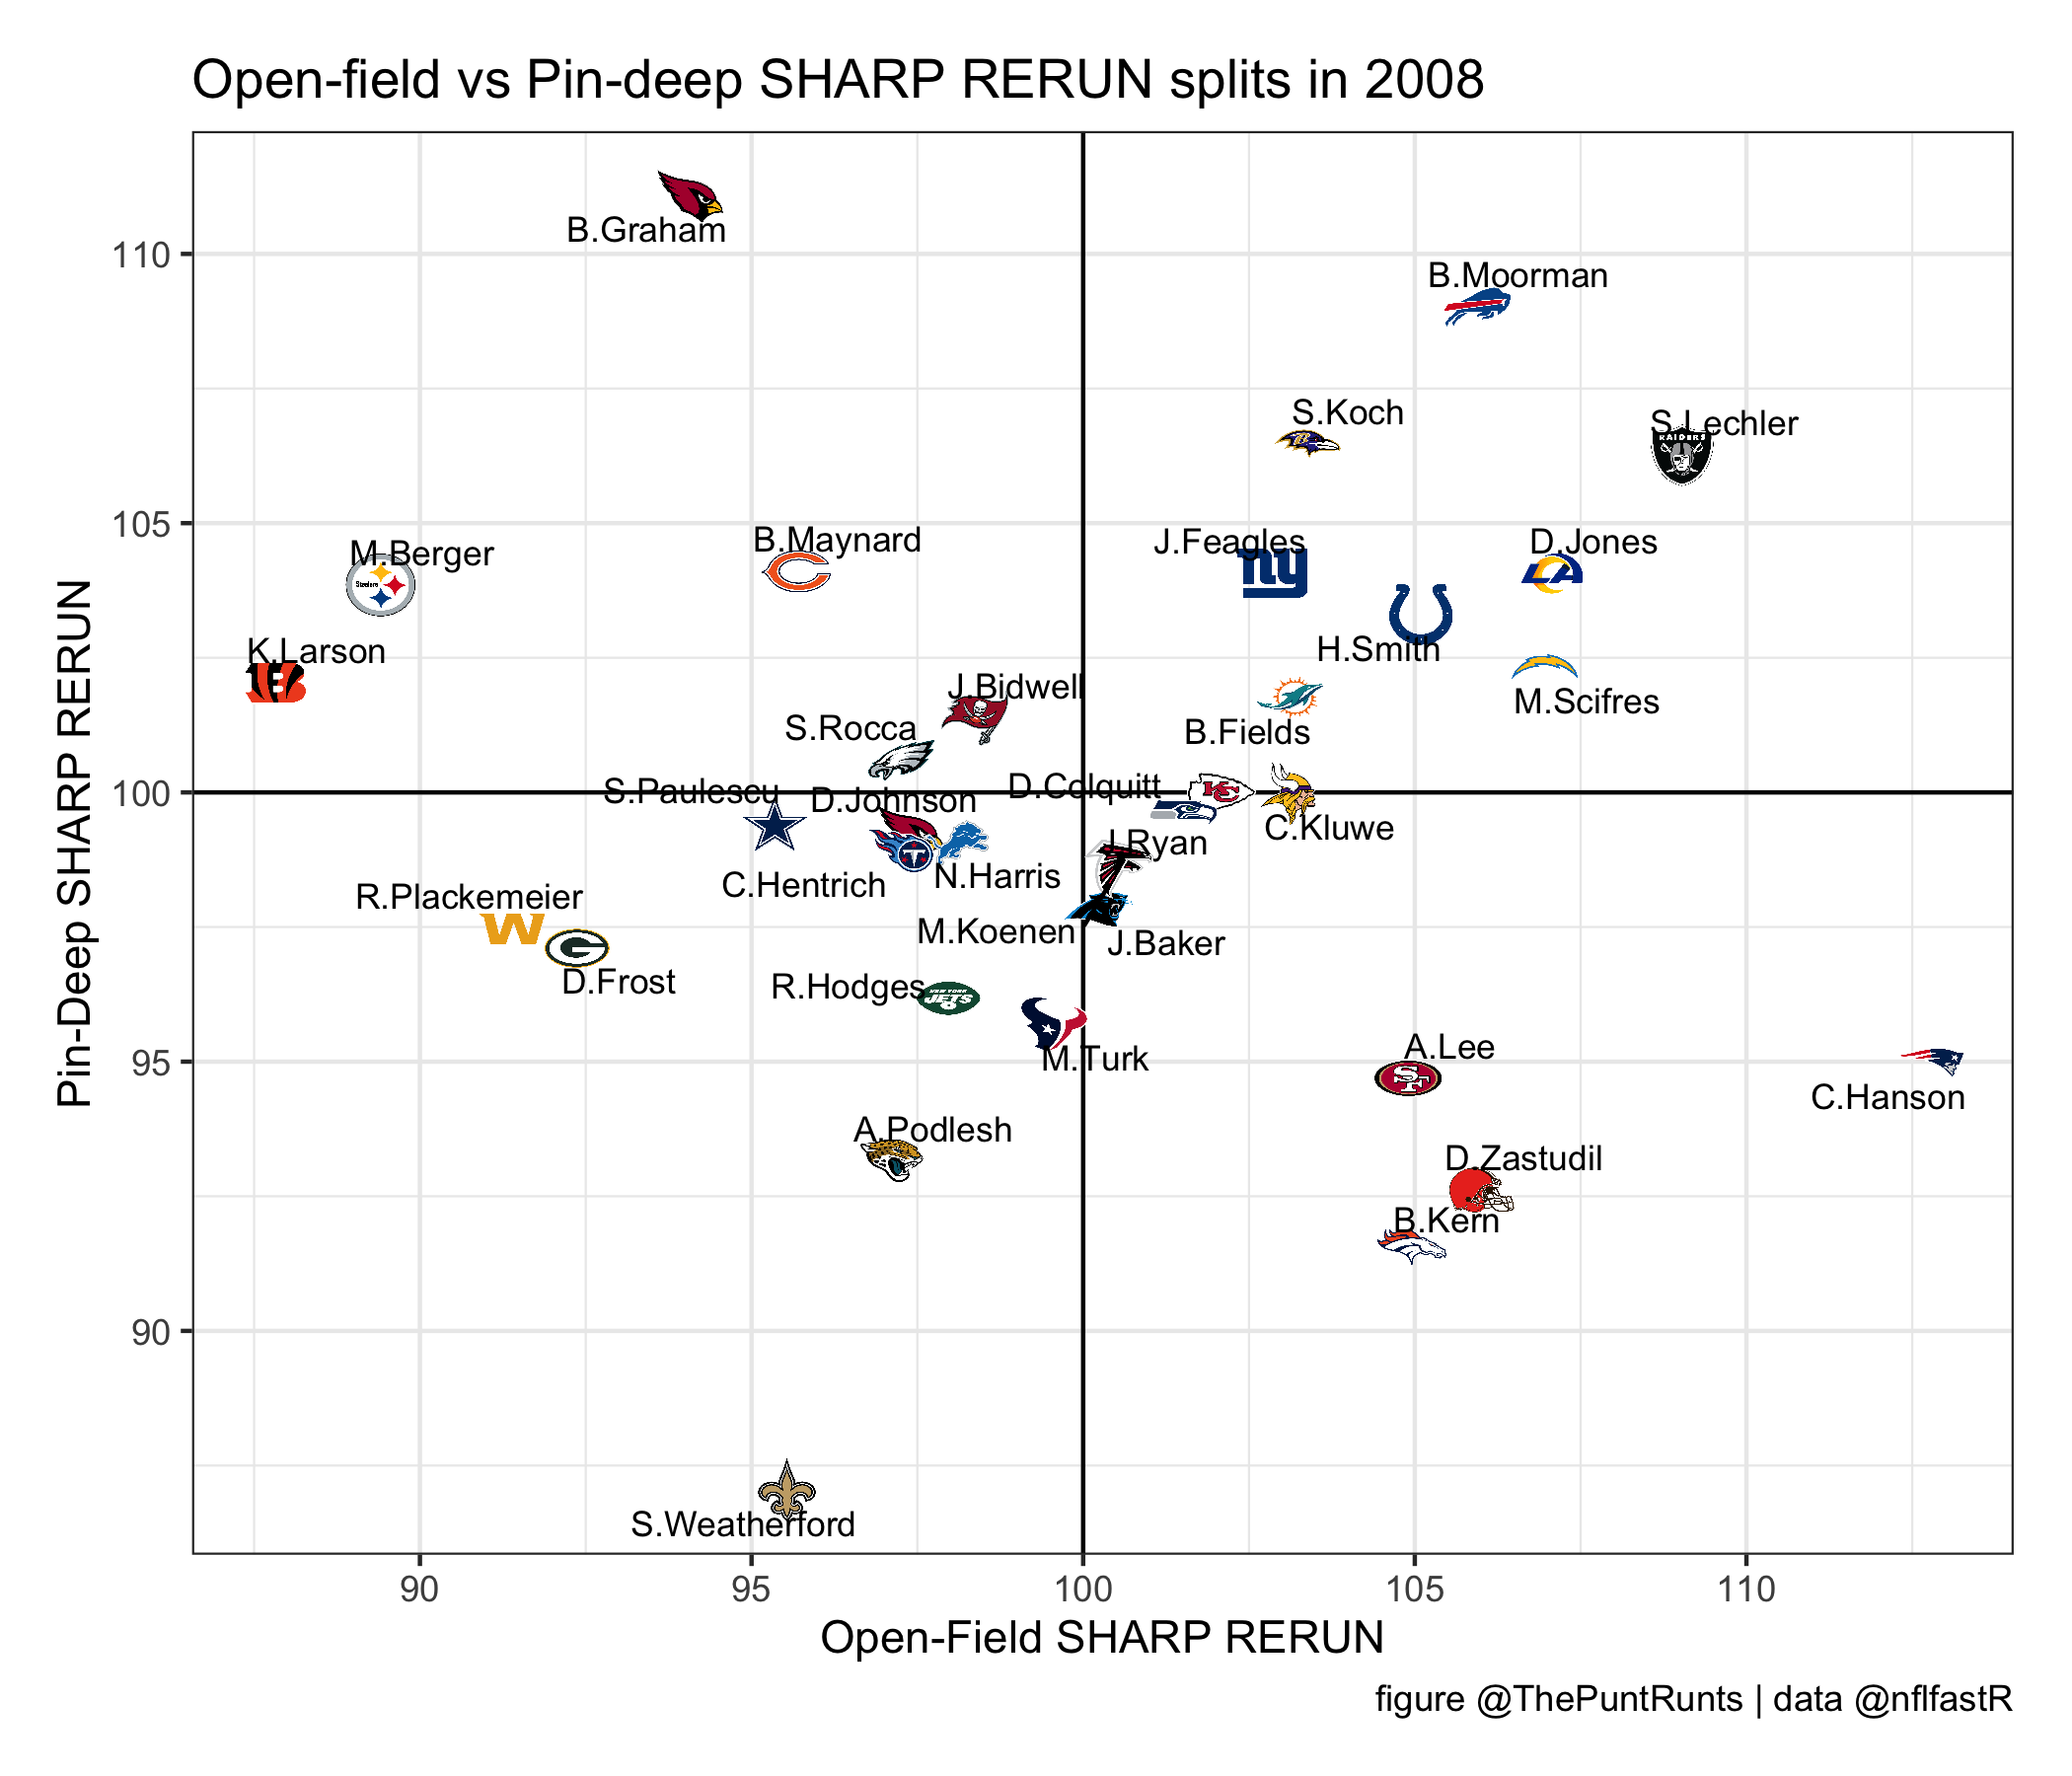
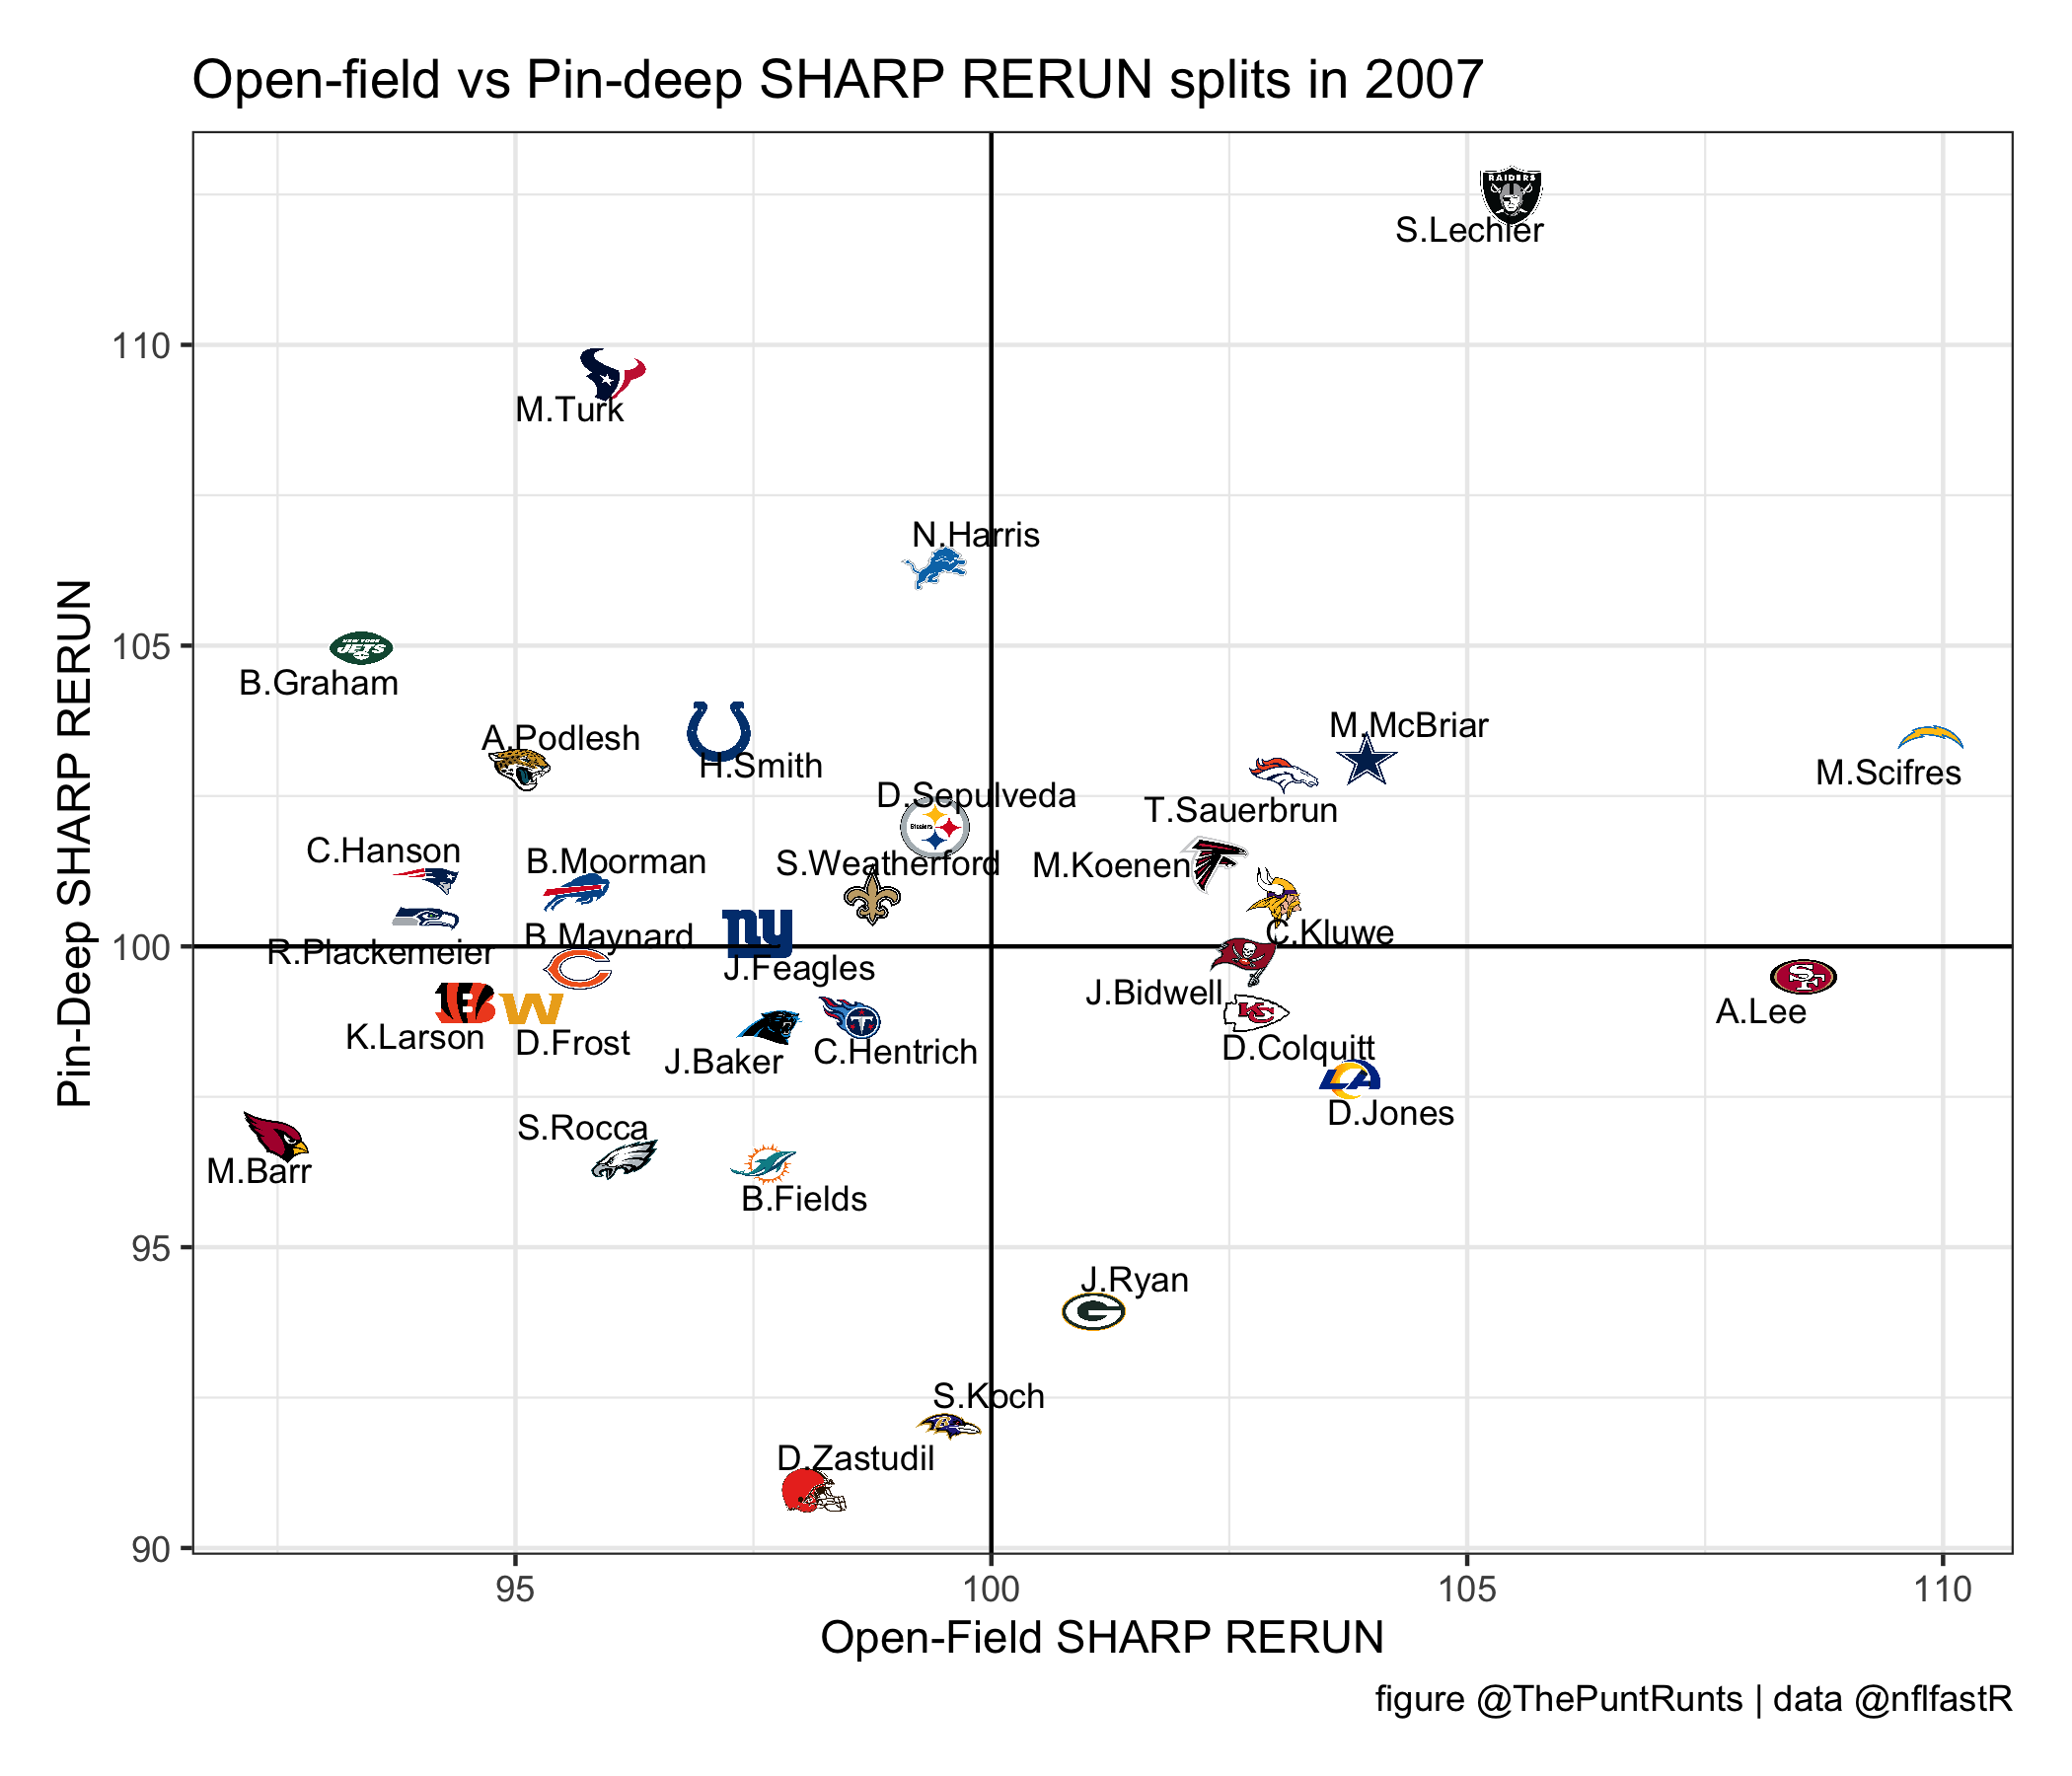
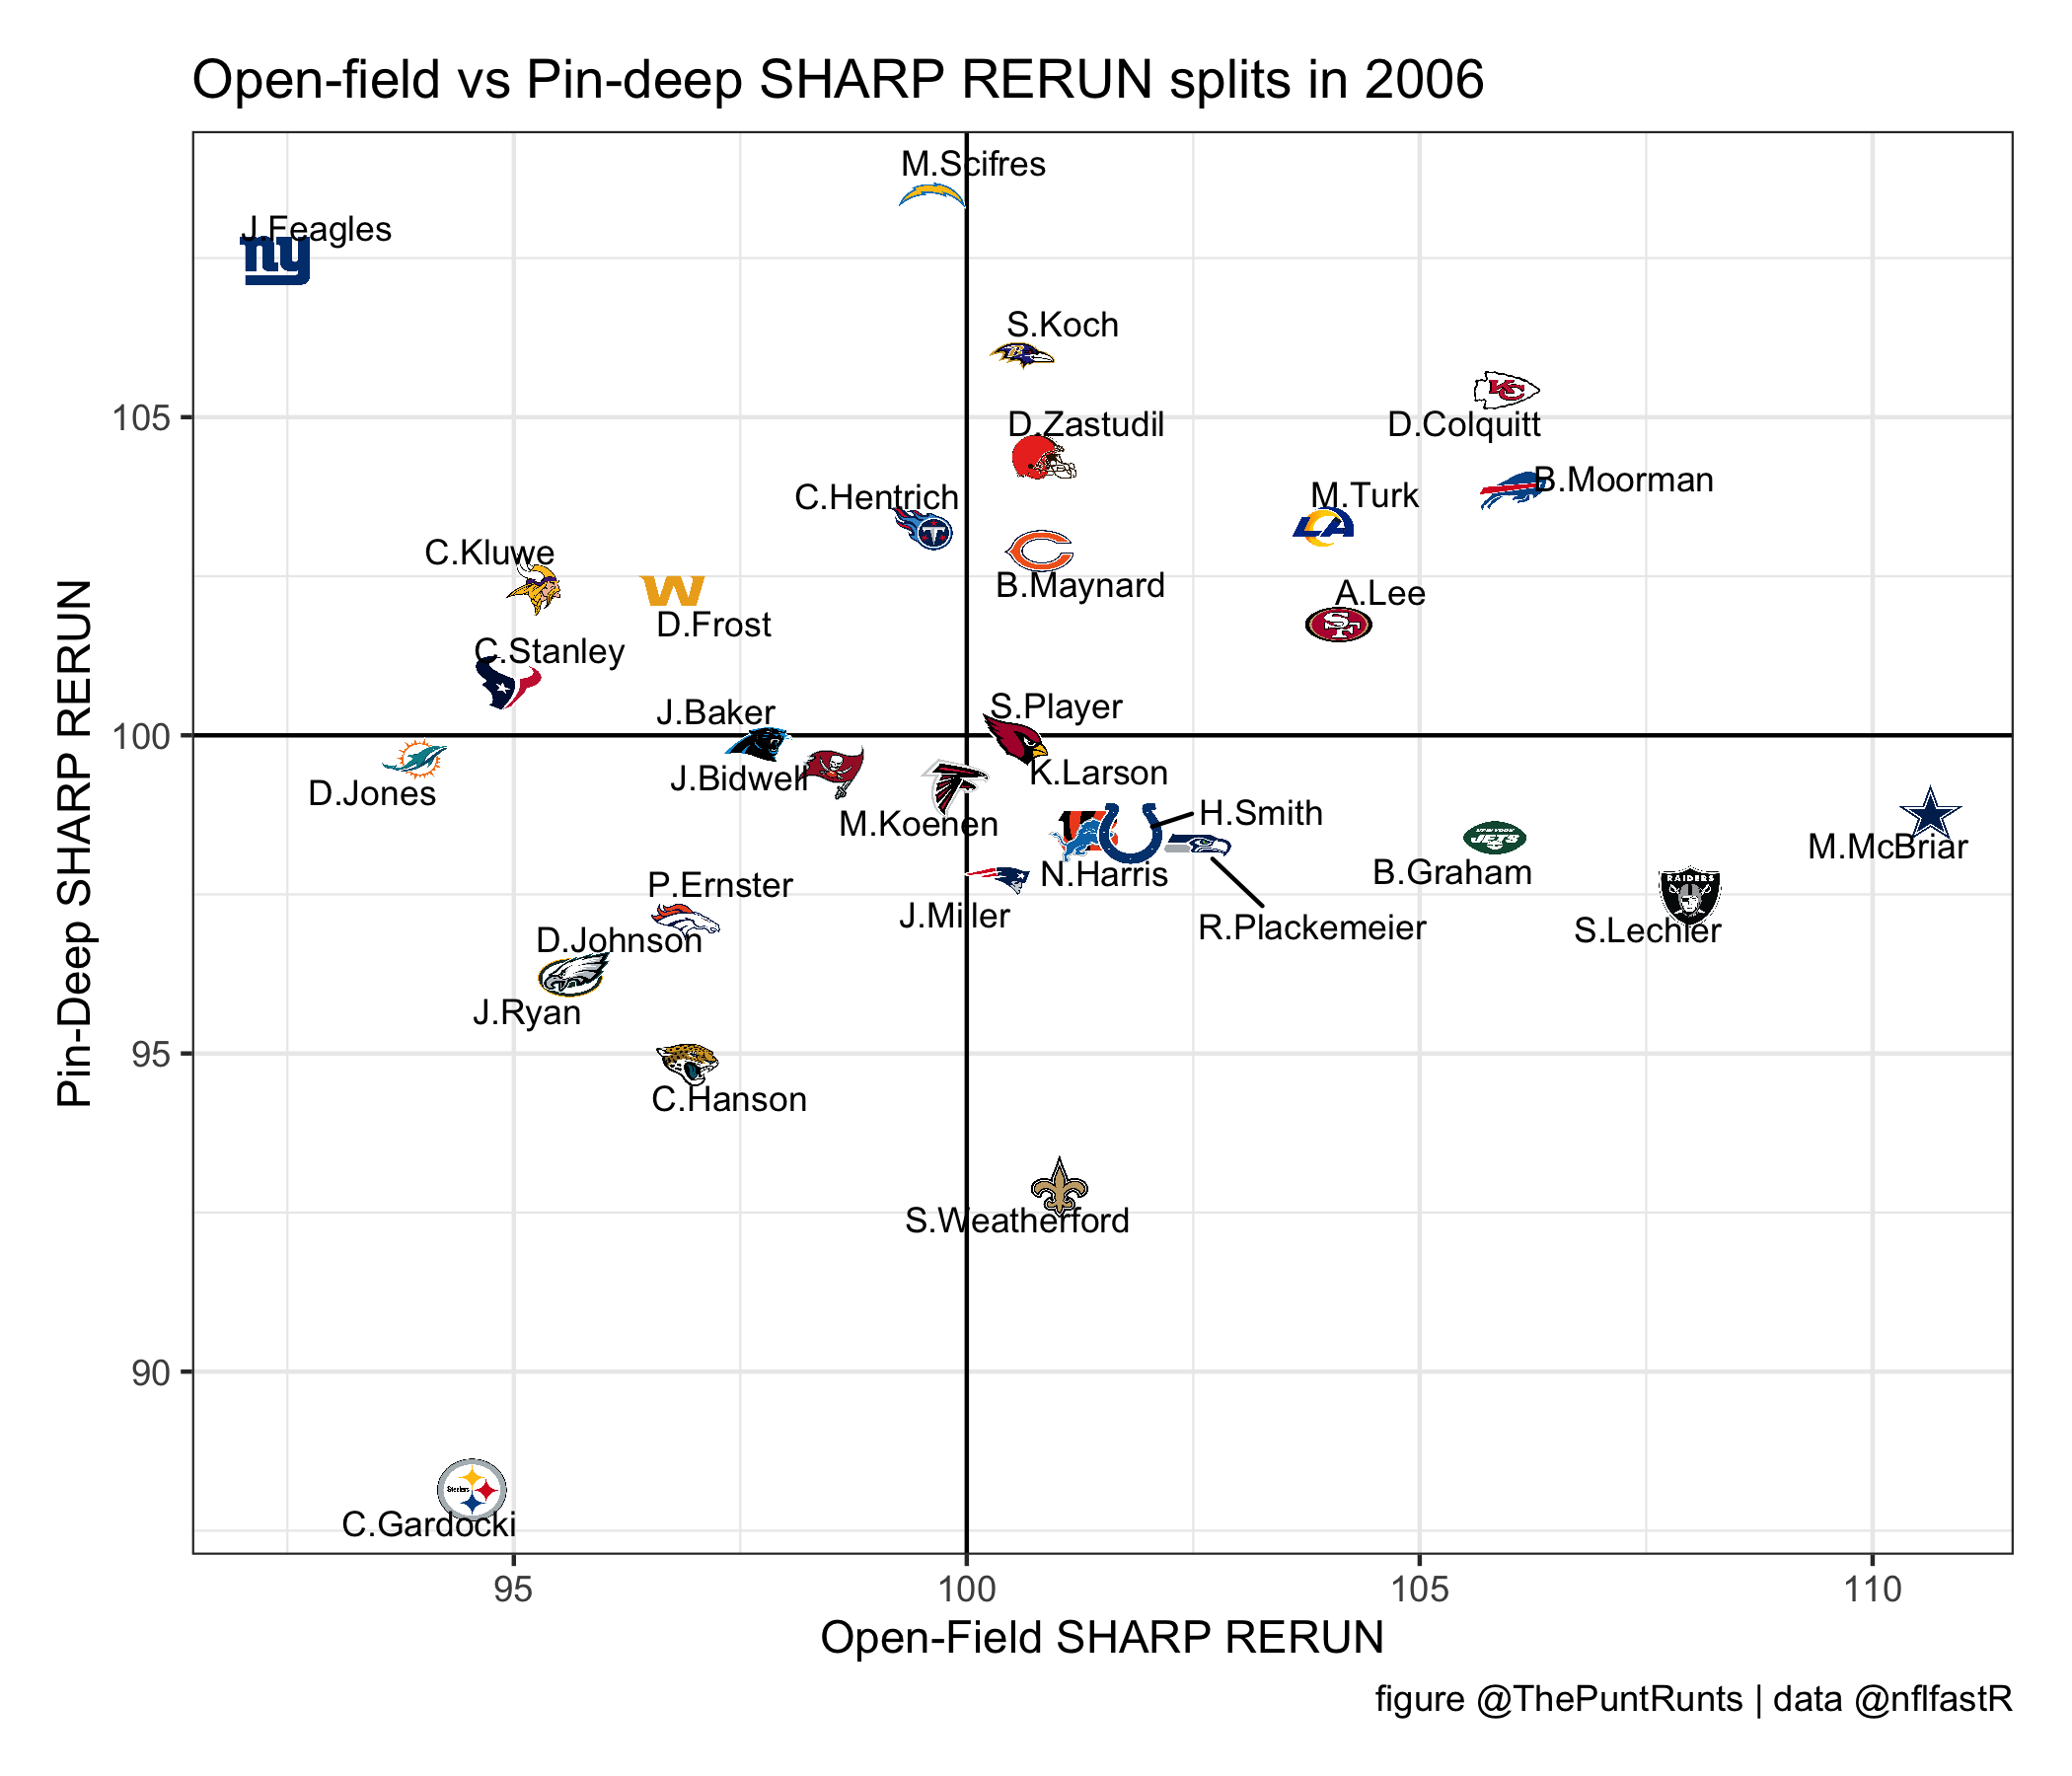
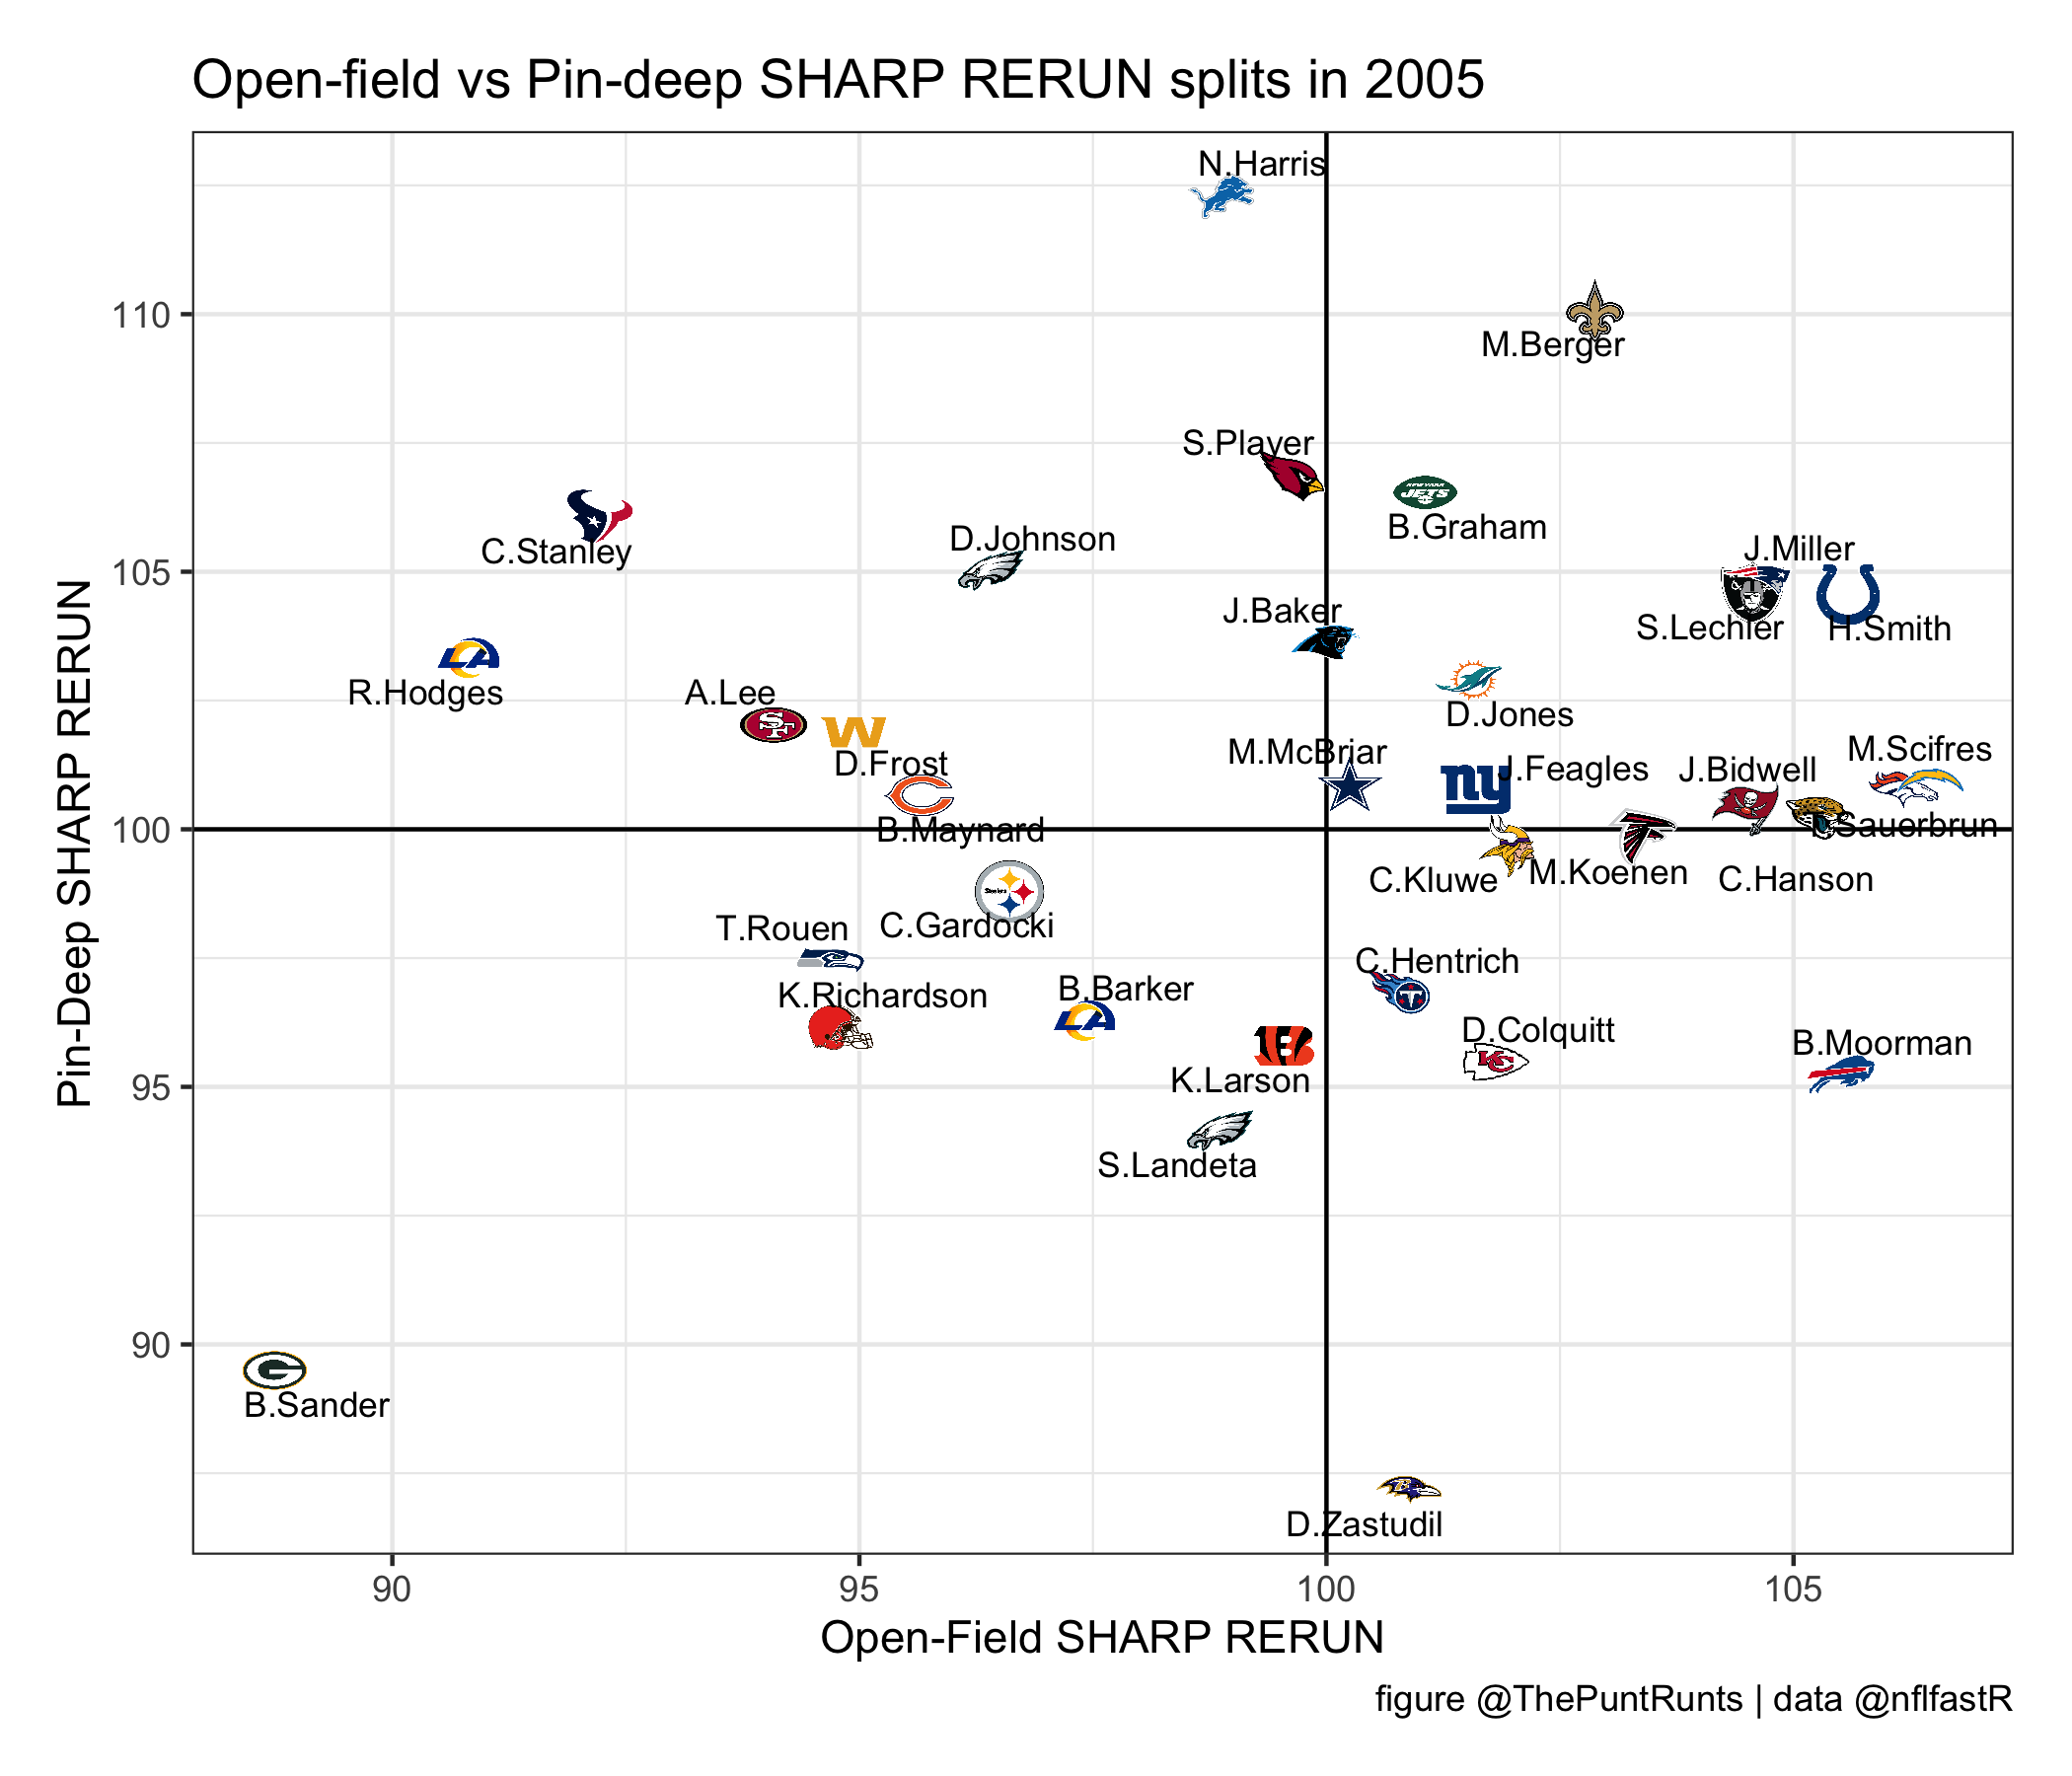
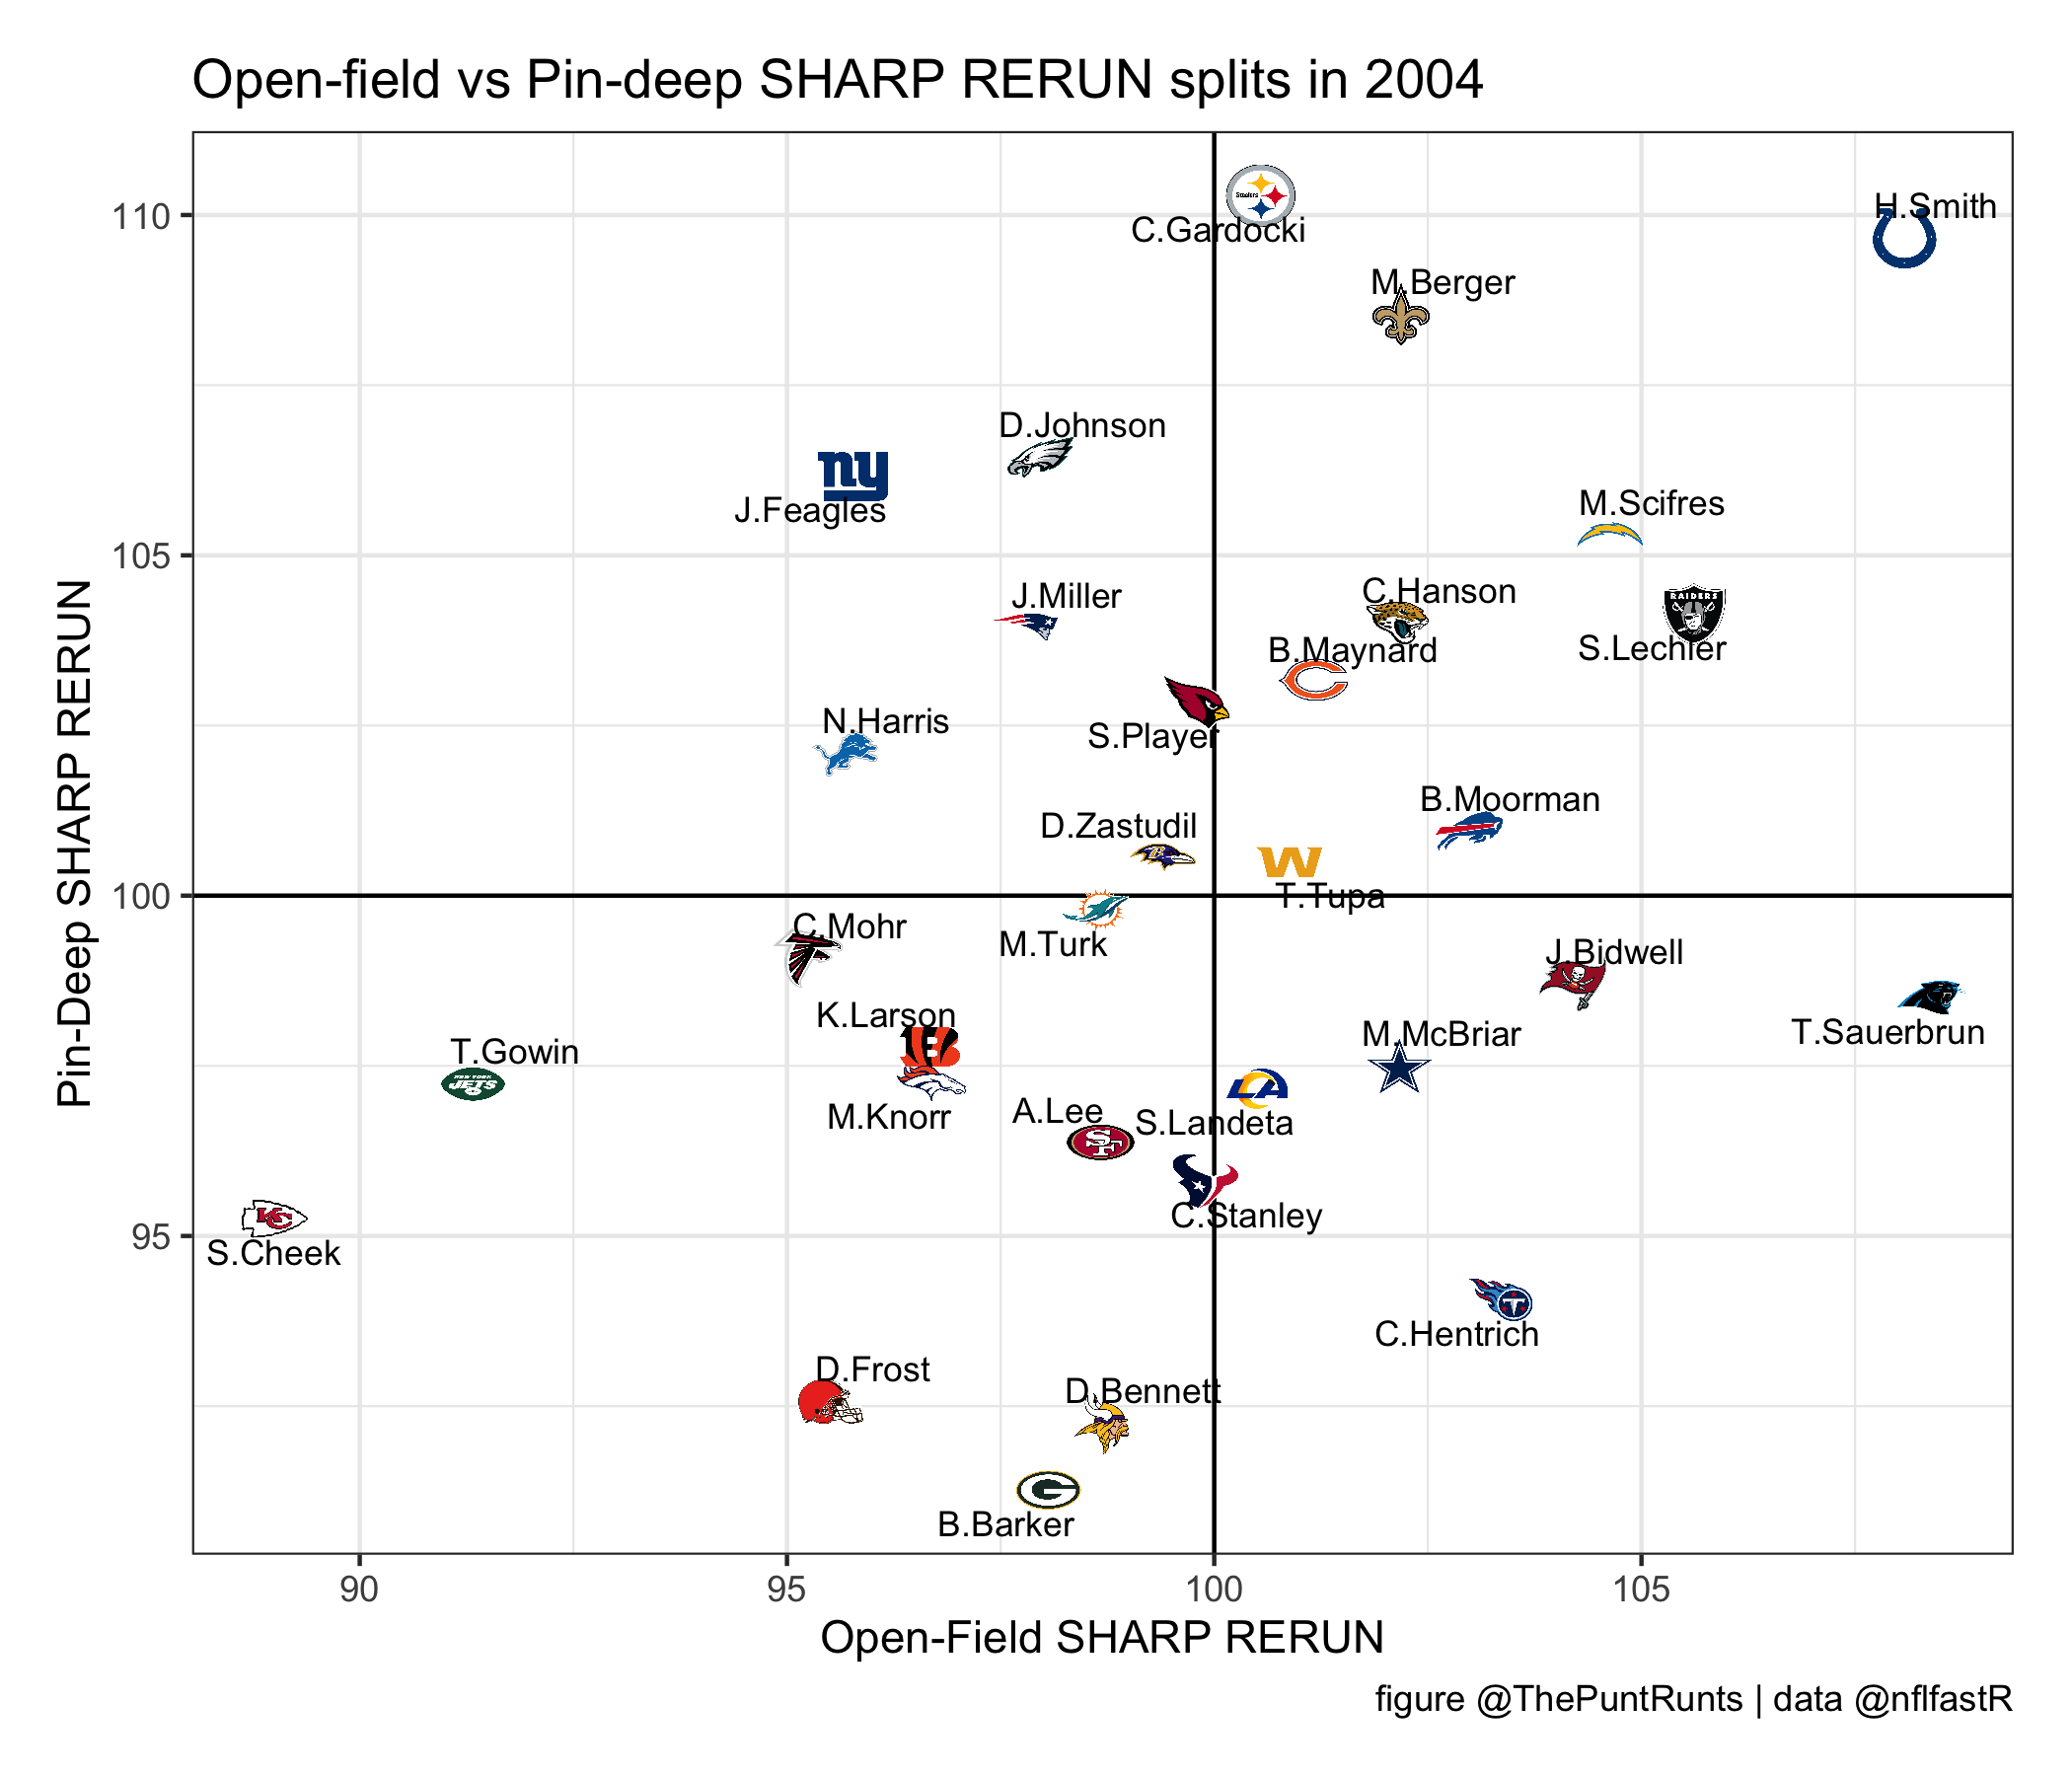
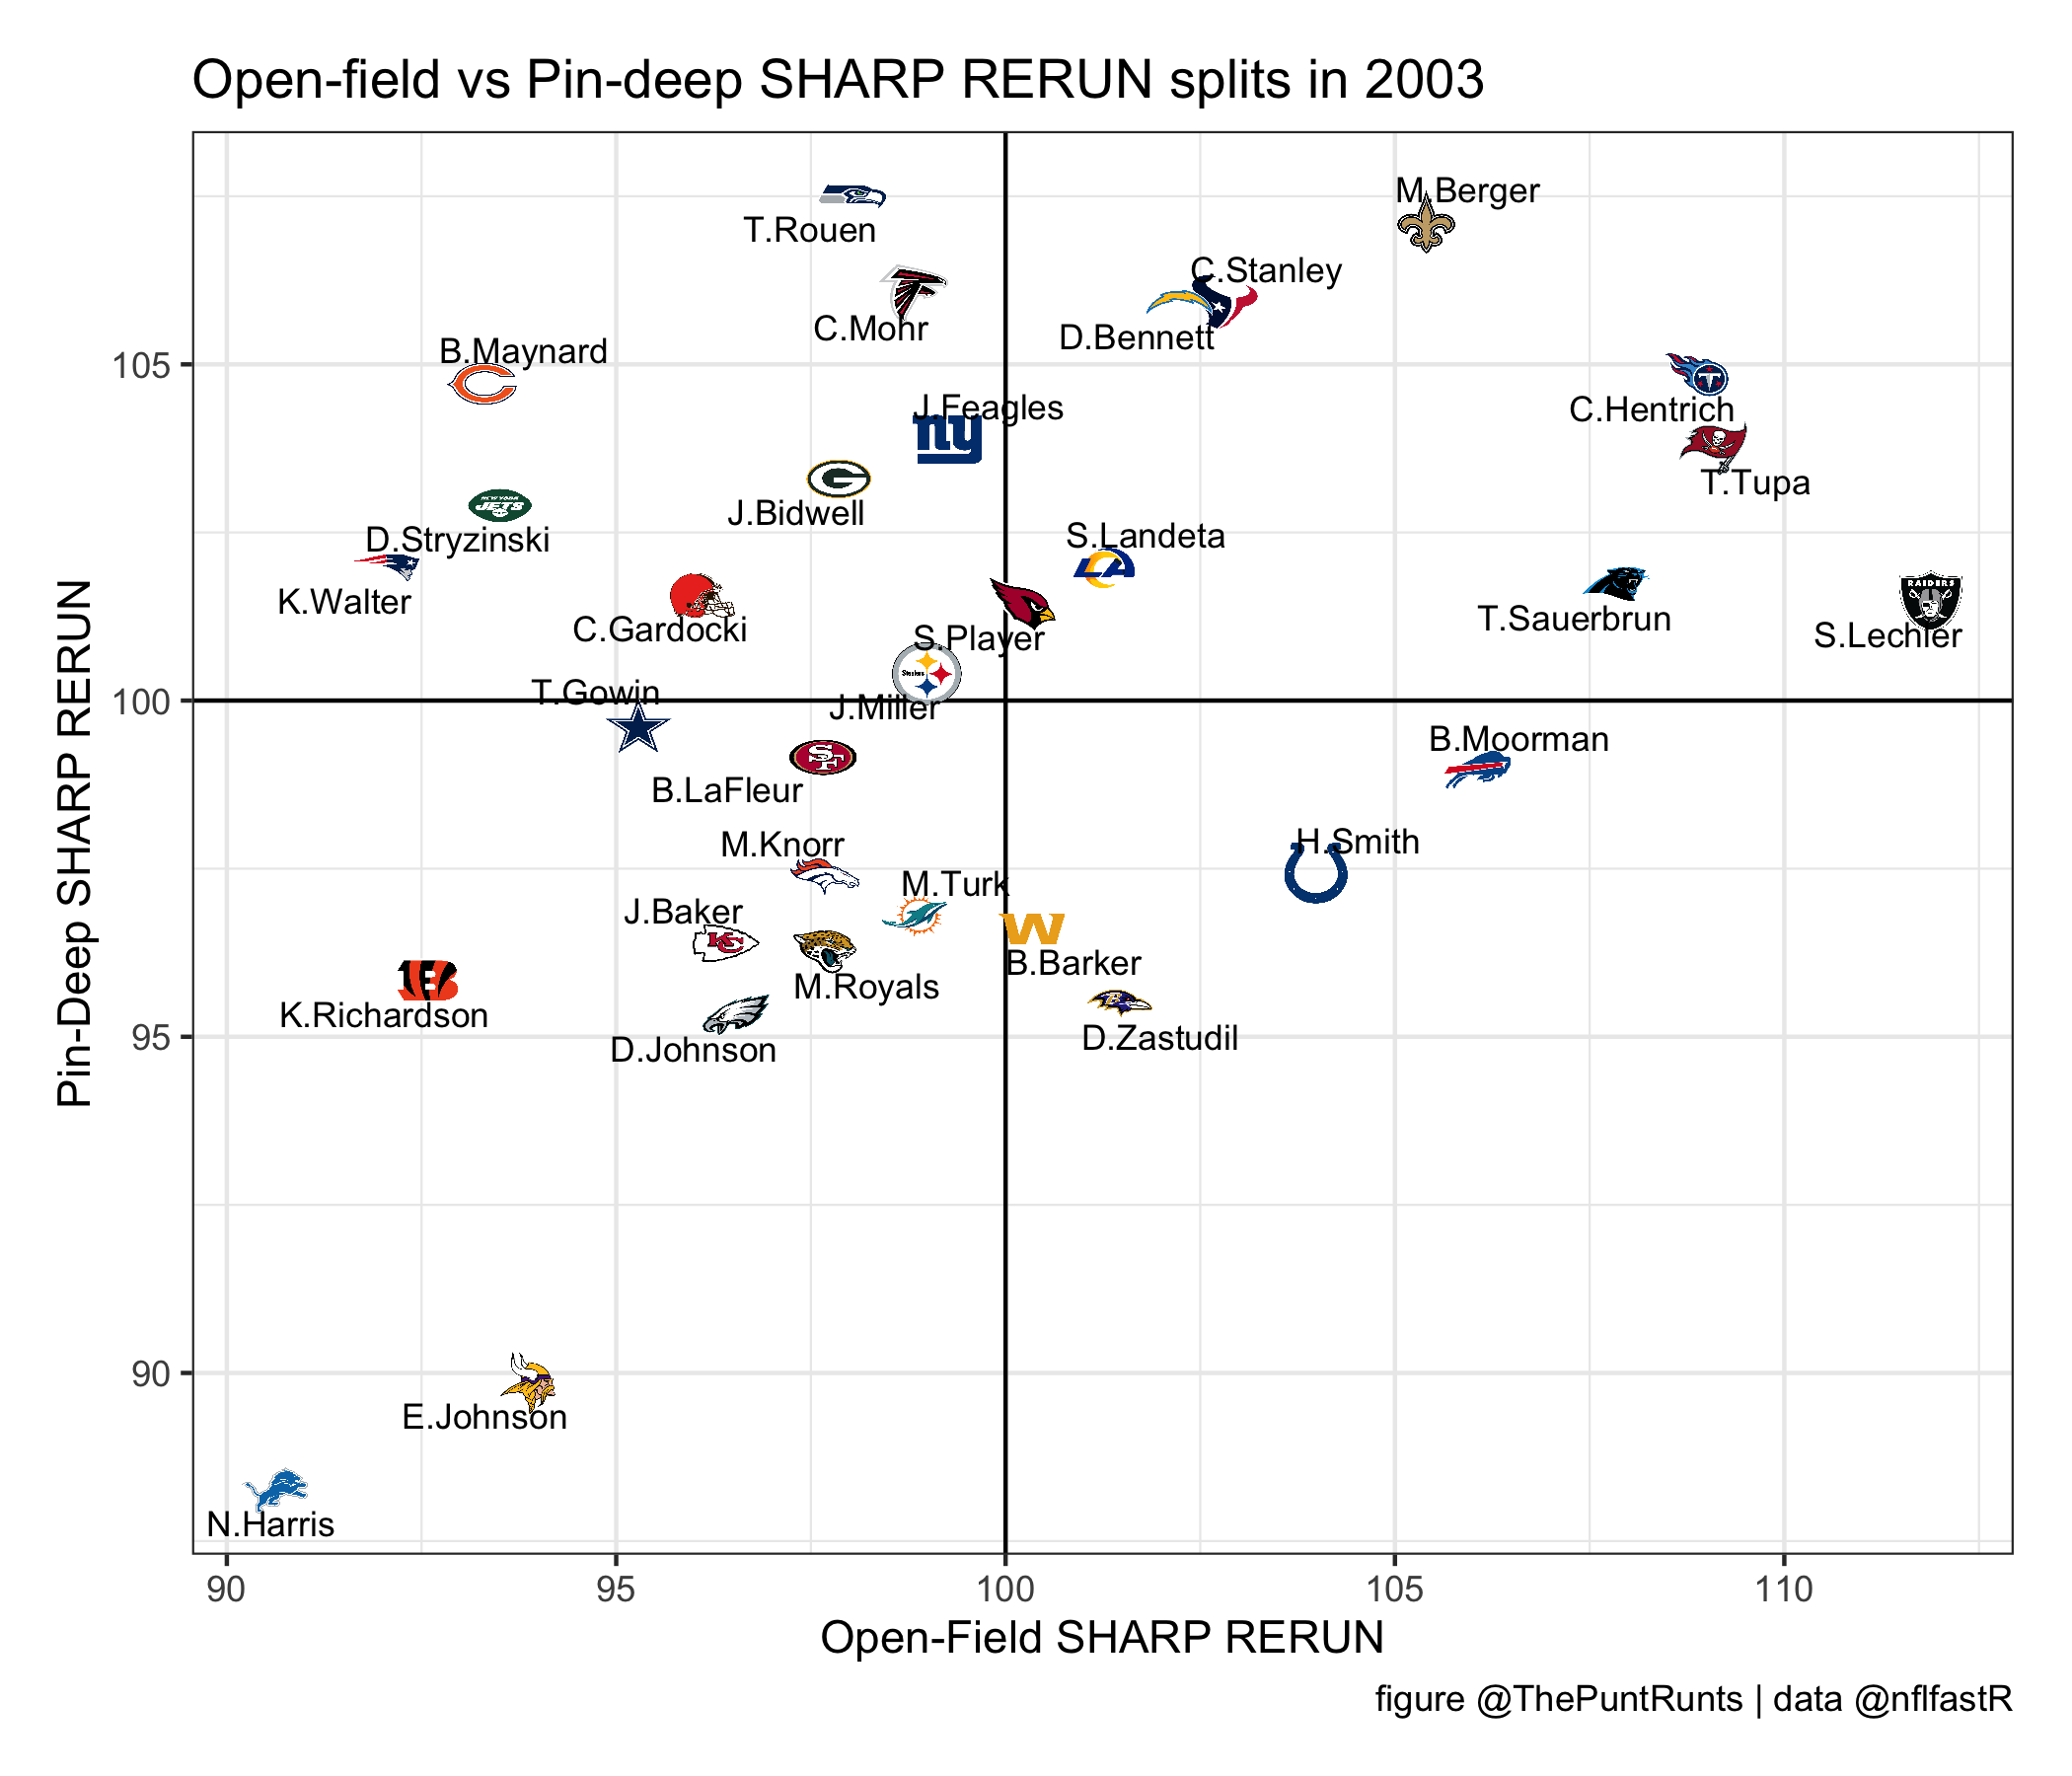
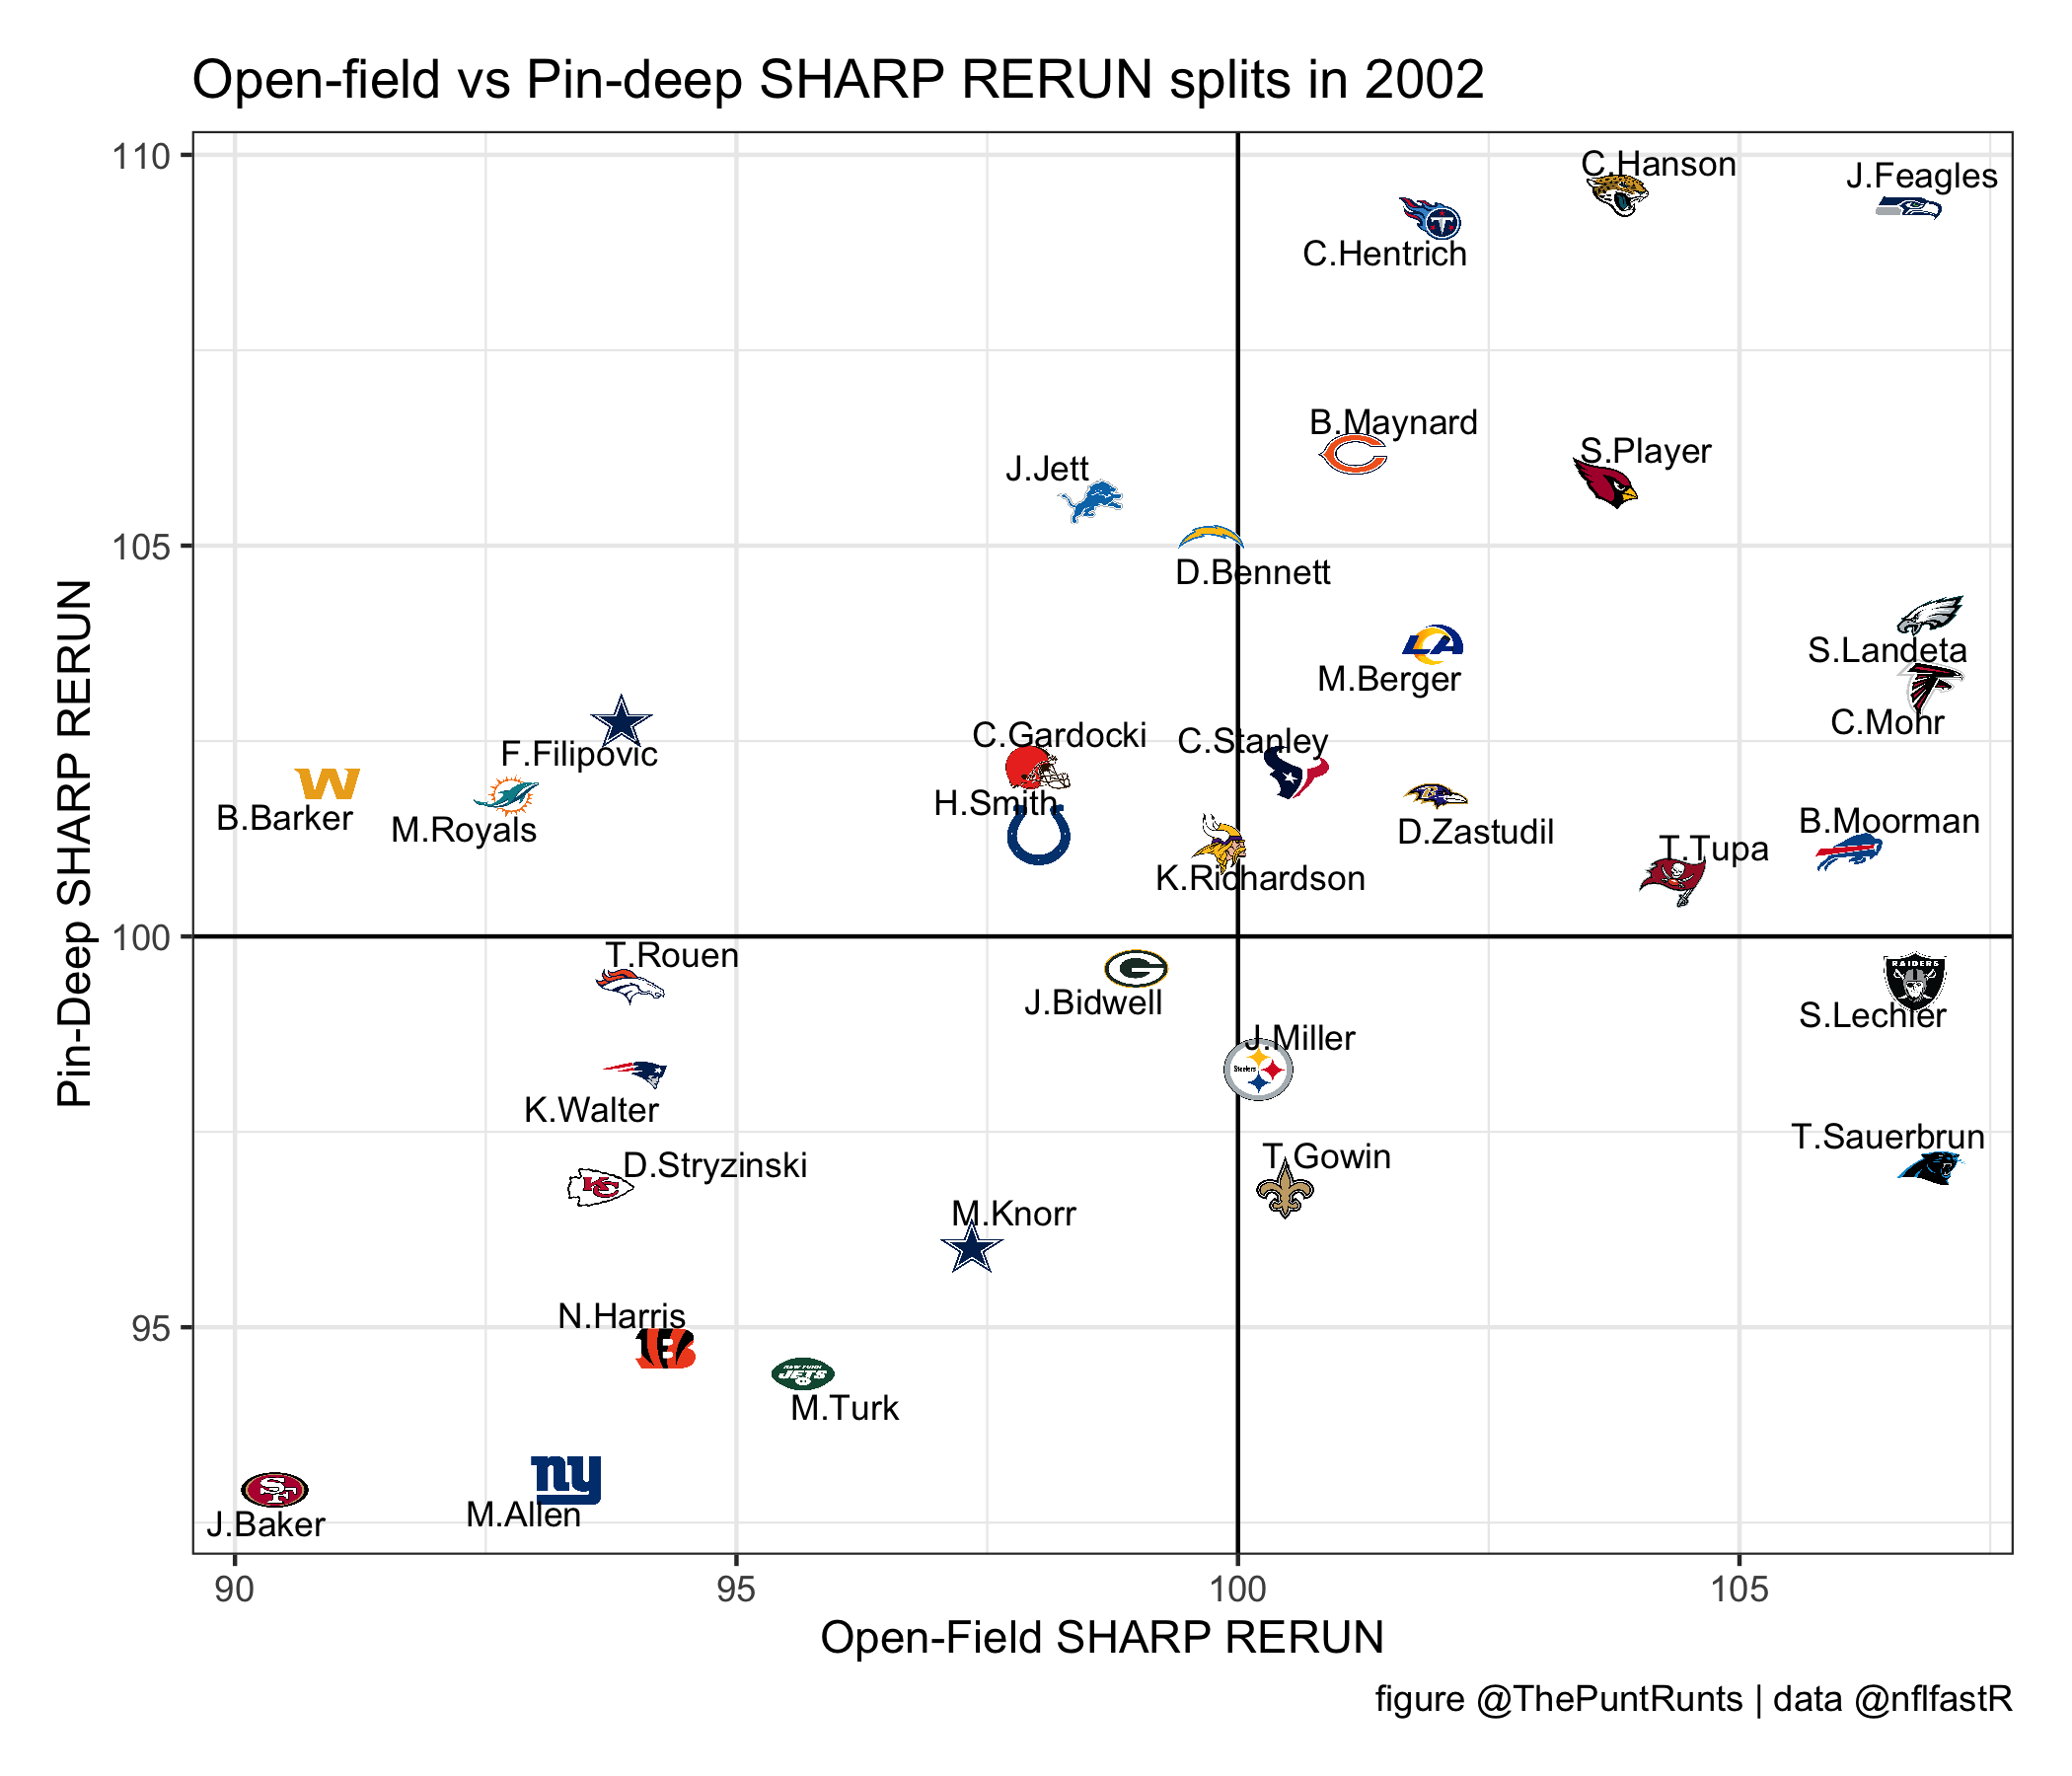
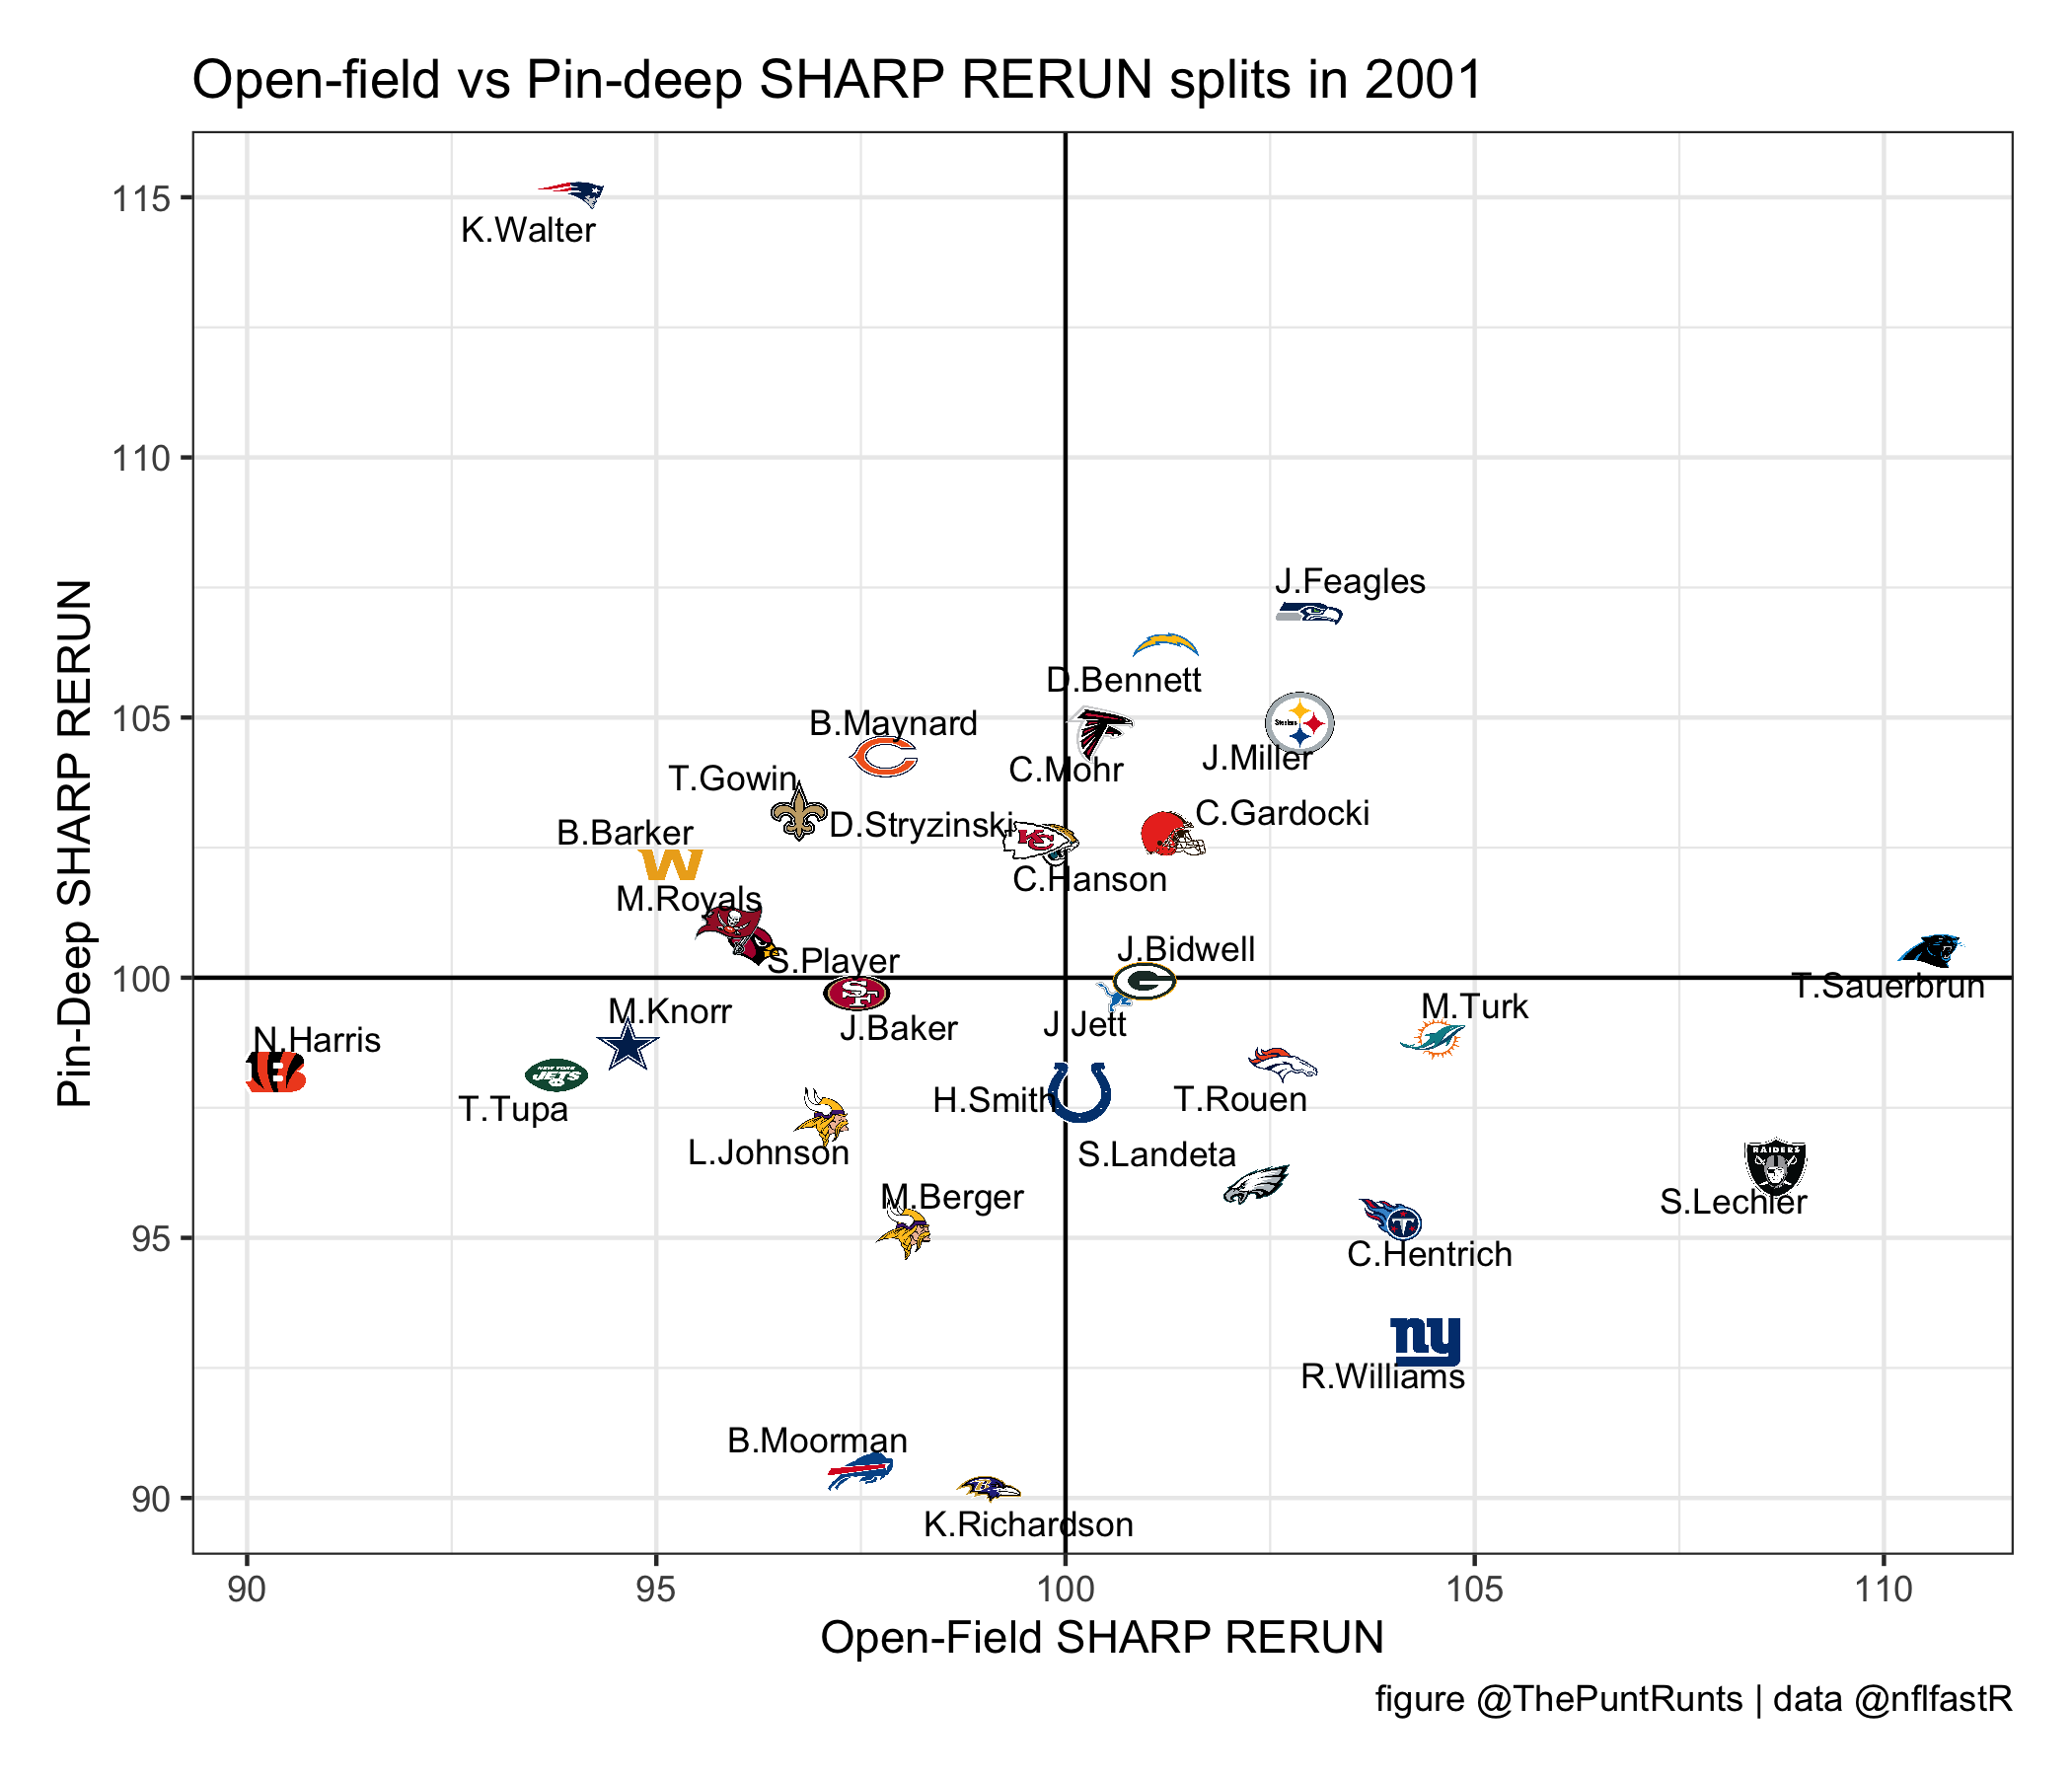
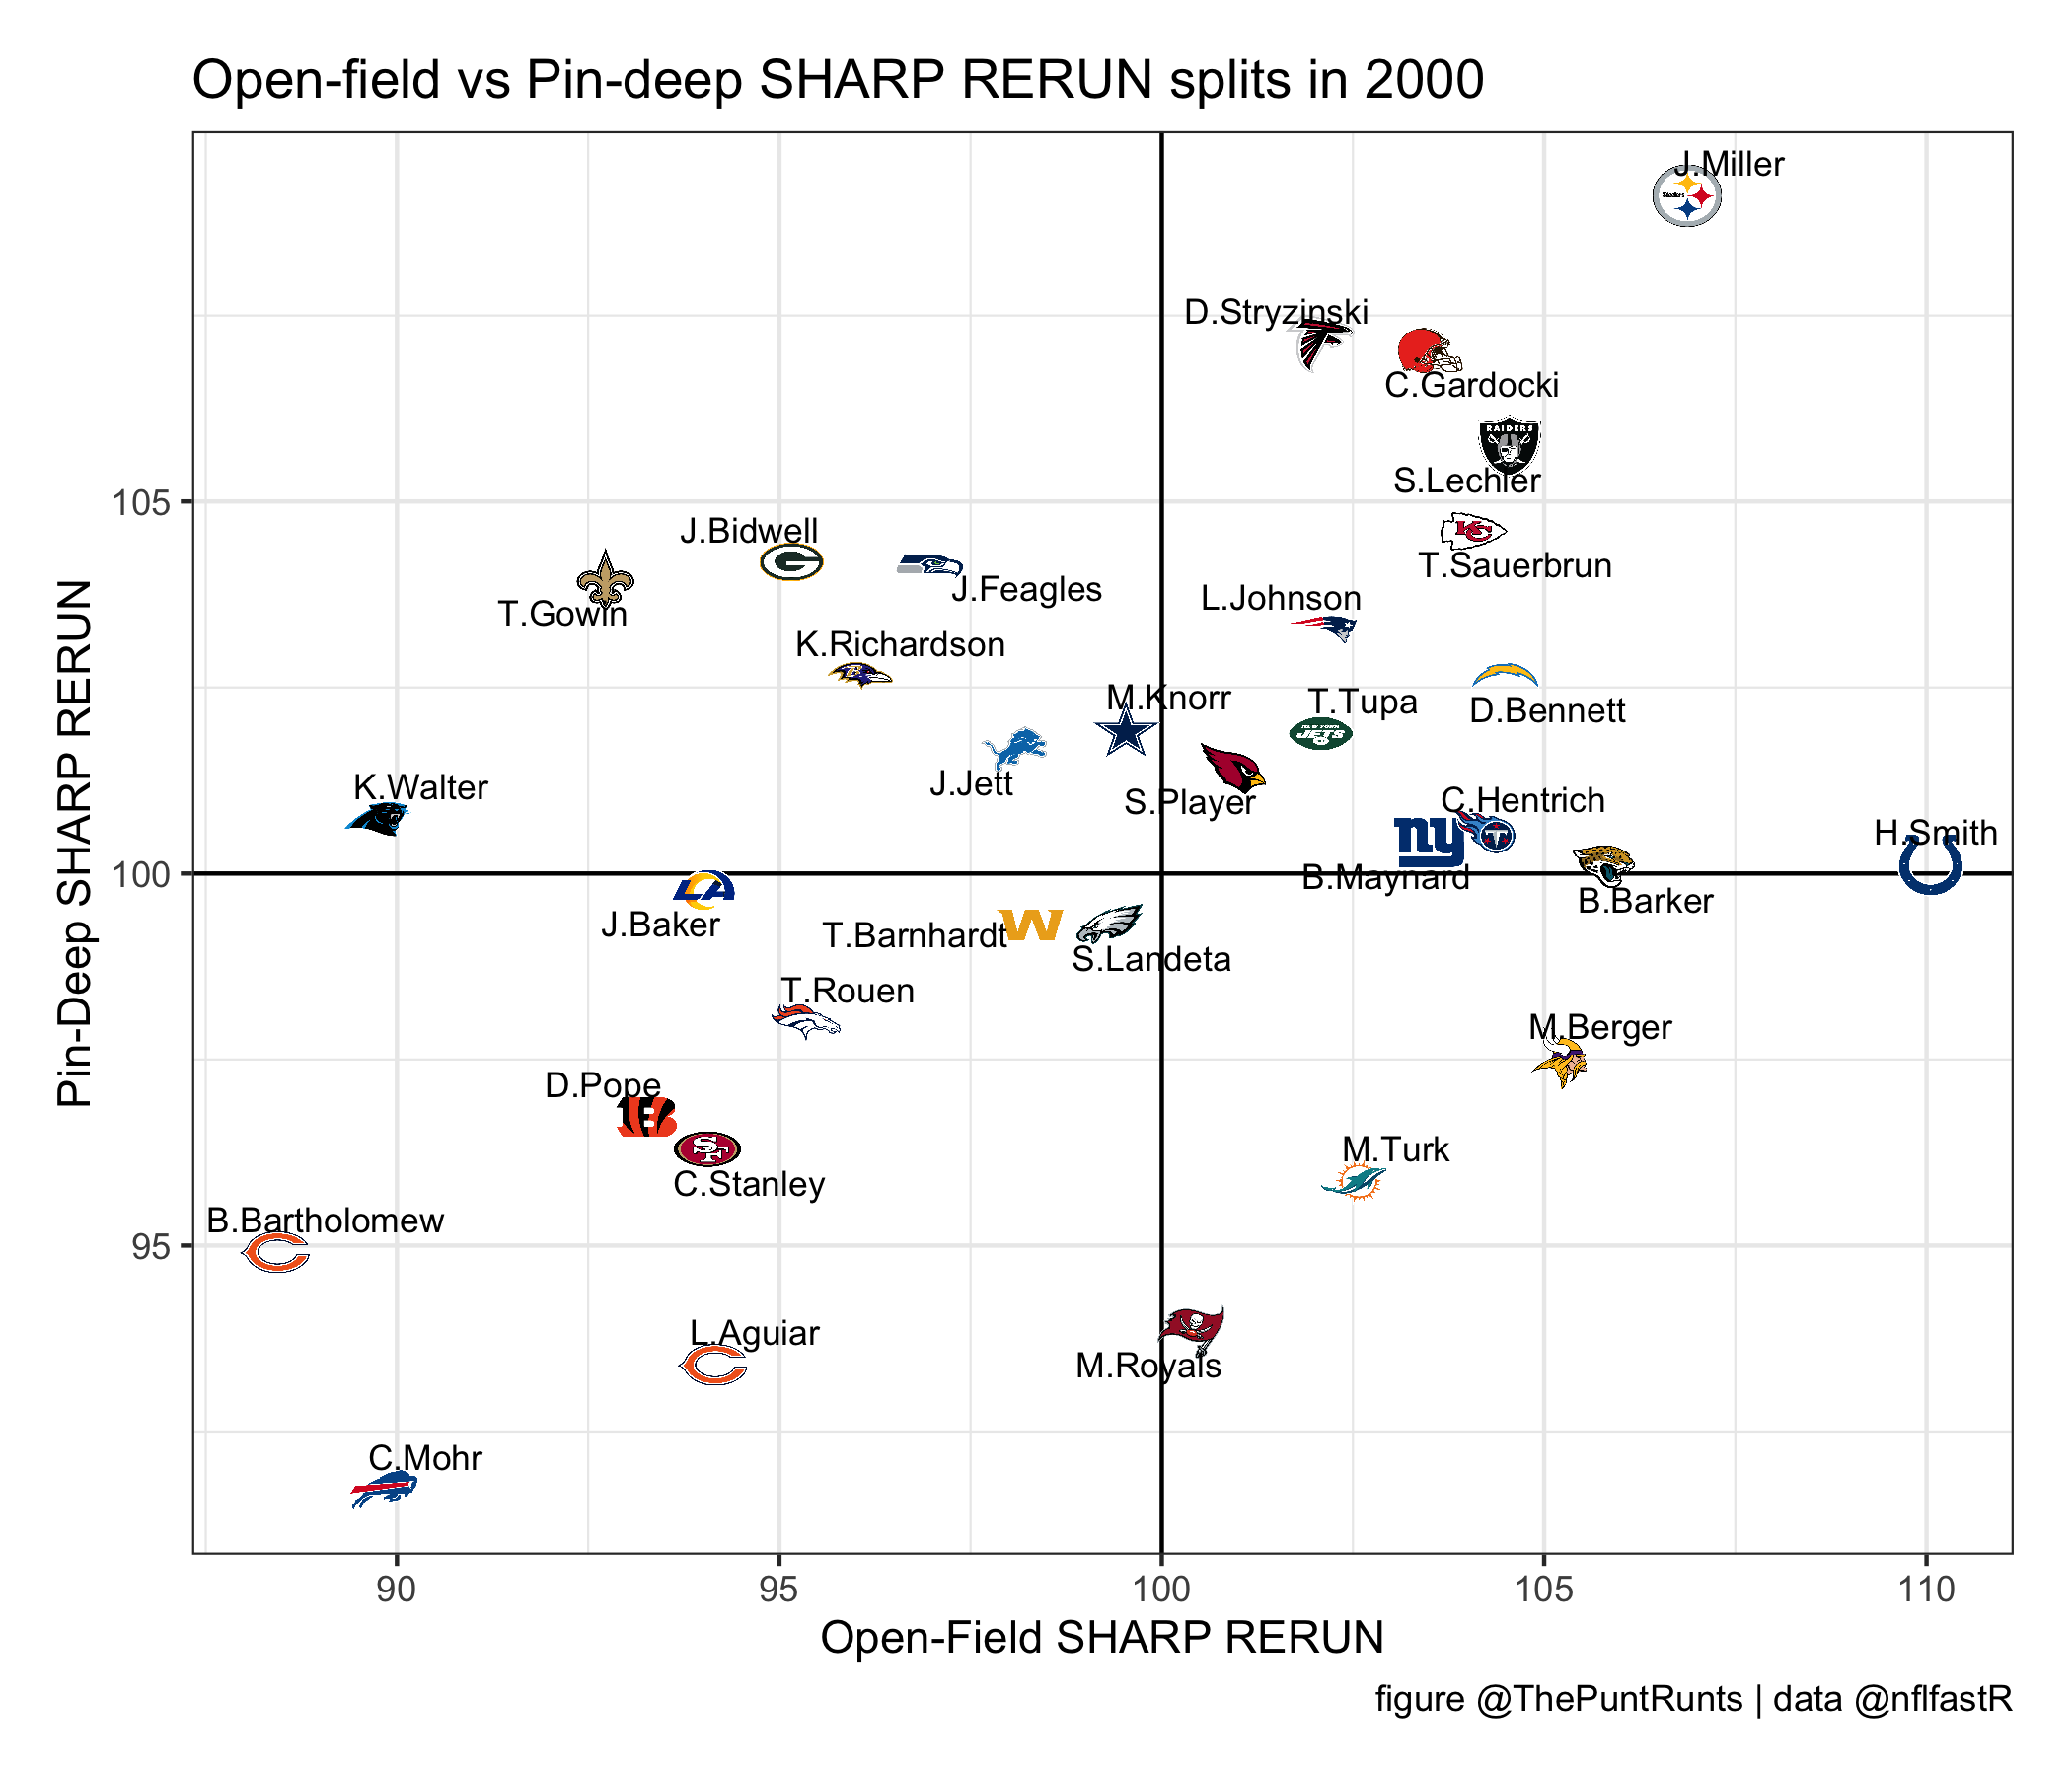
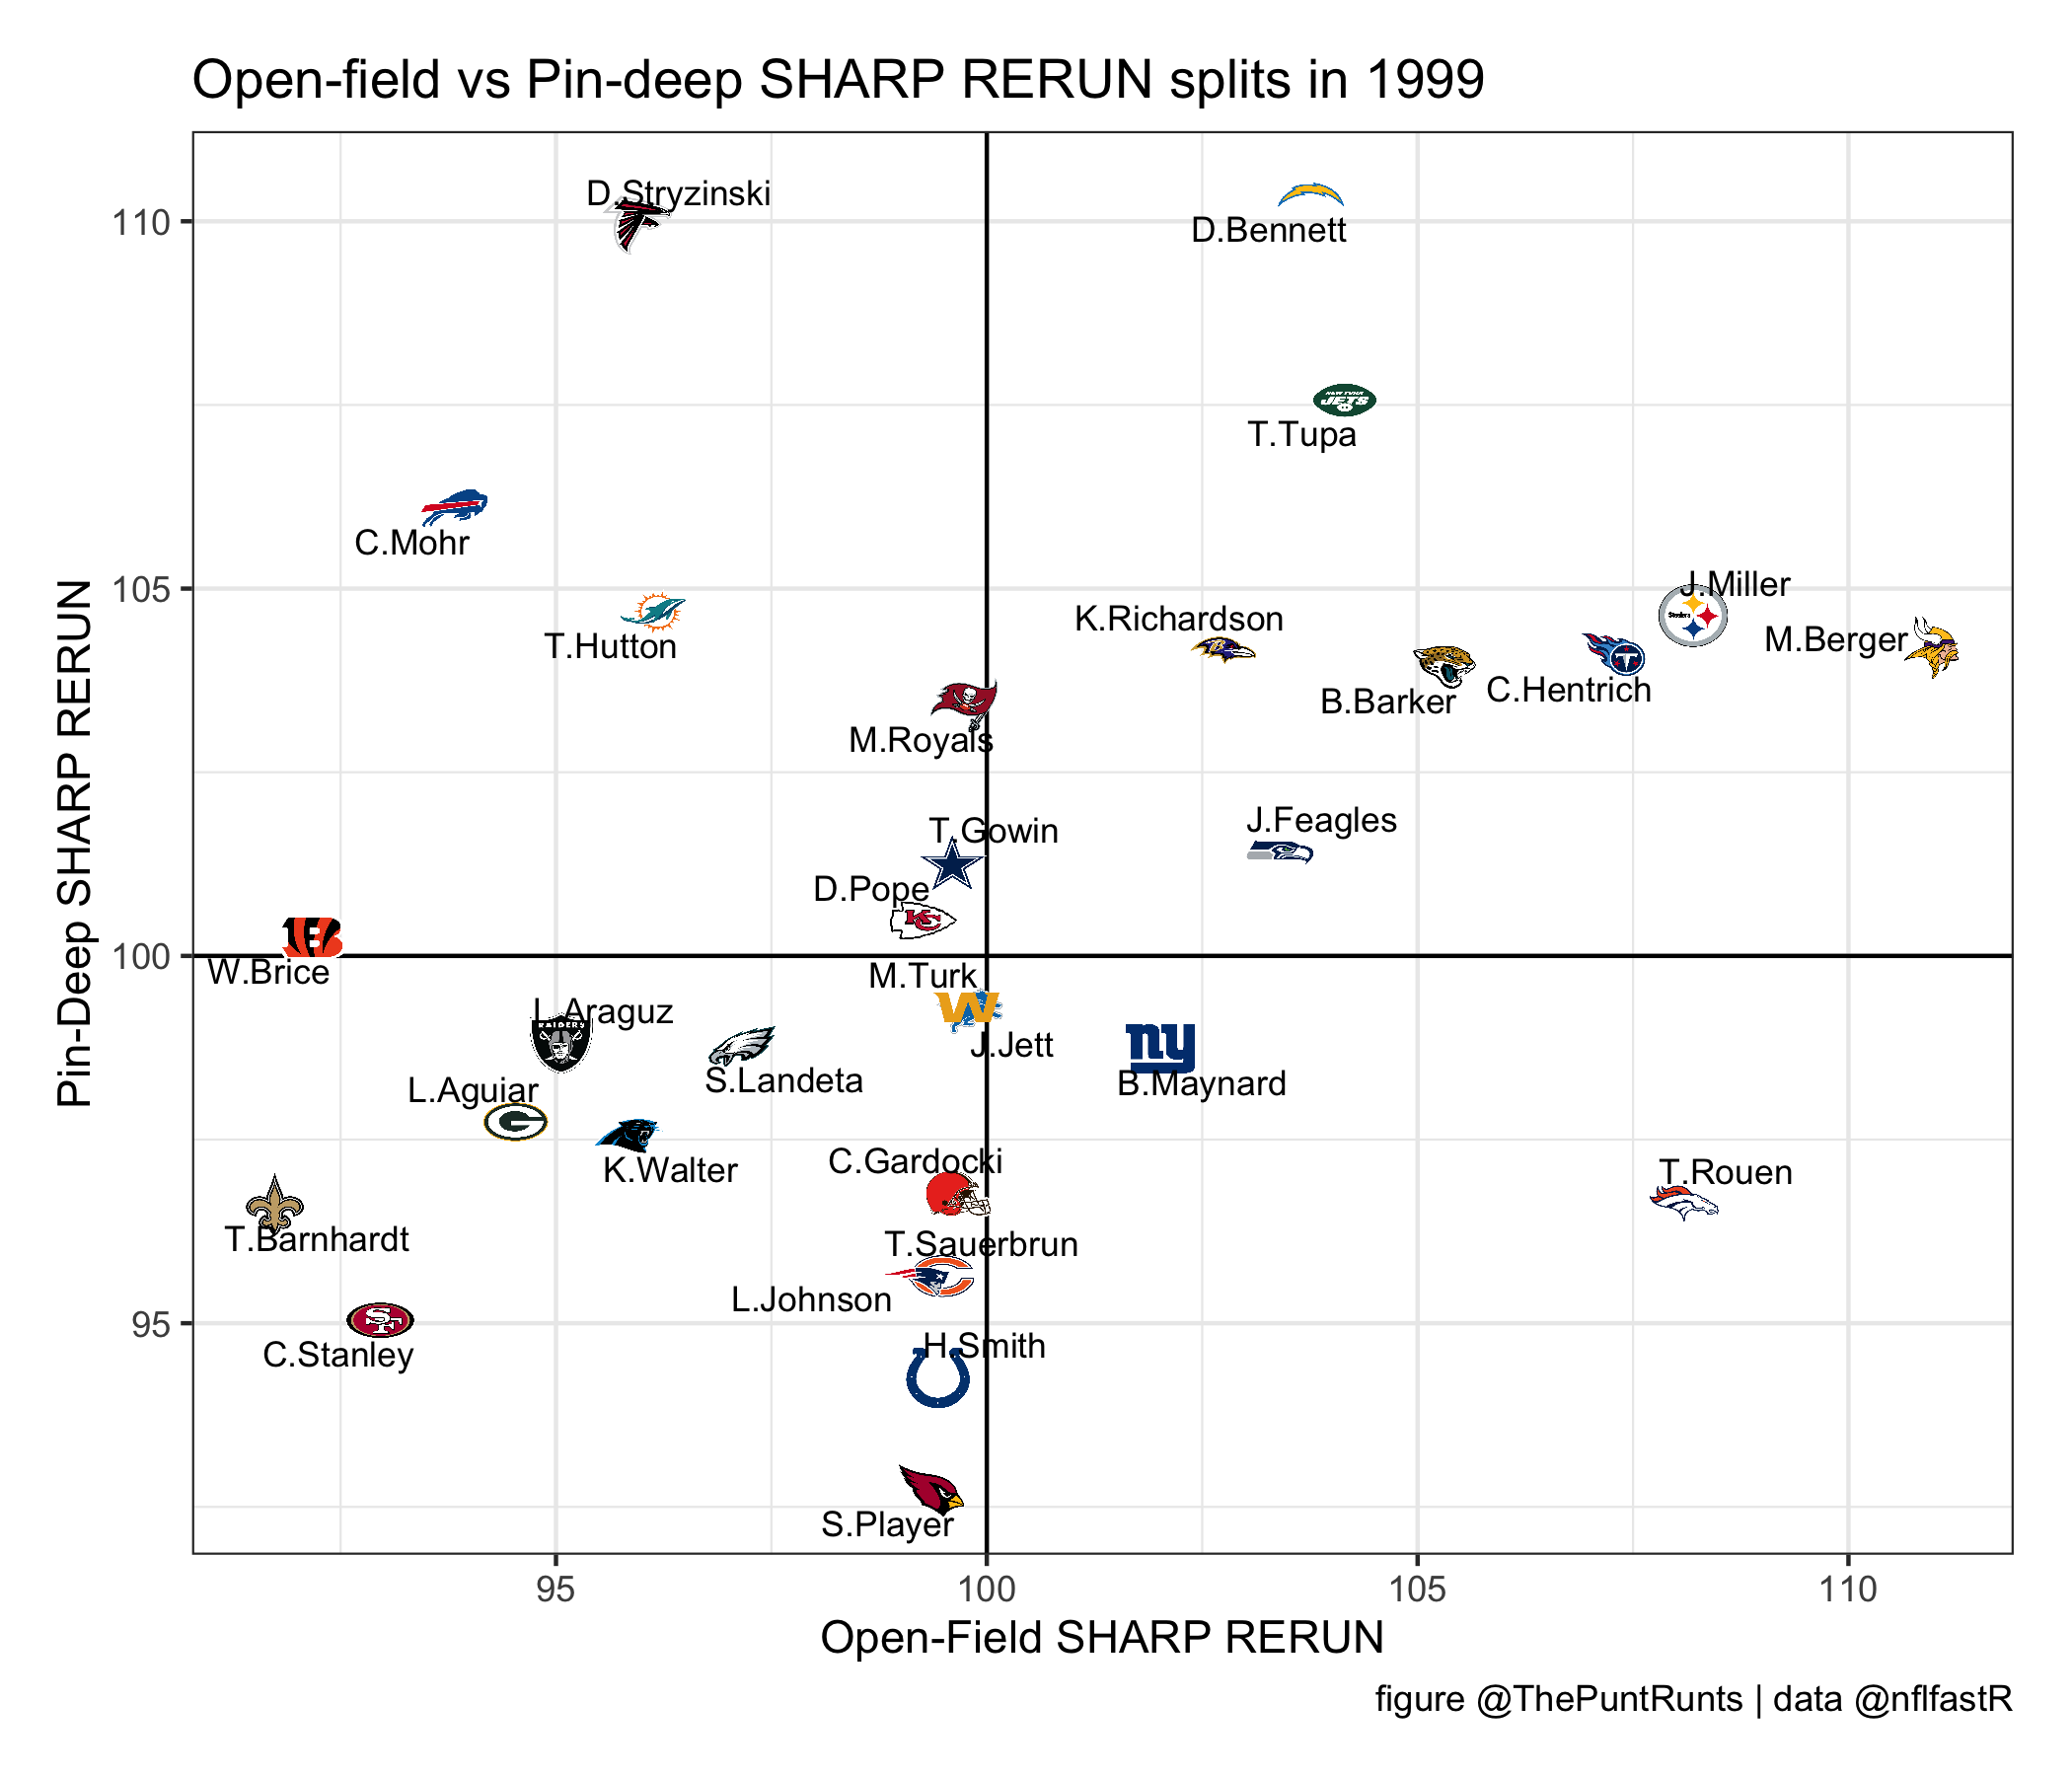
Open-Field vs. Pin-Deep performance
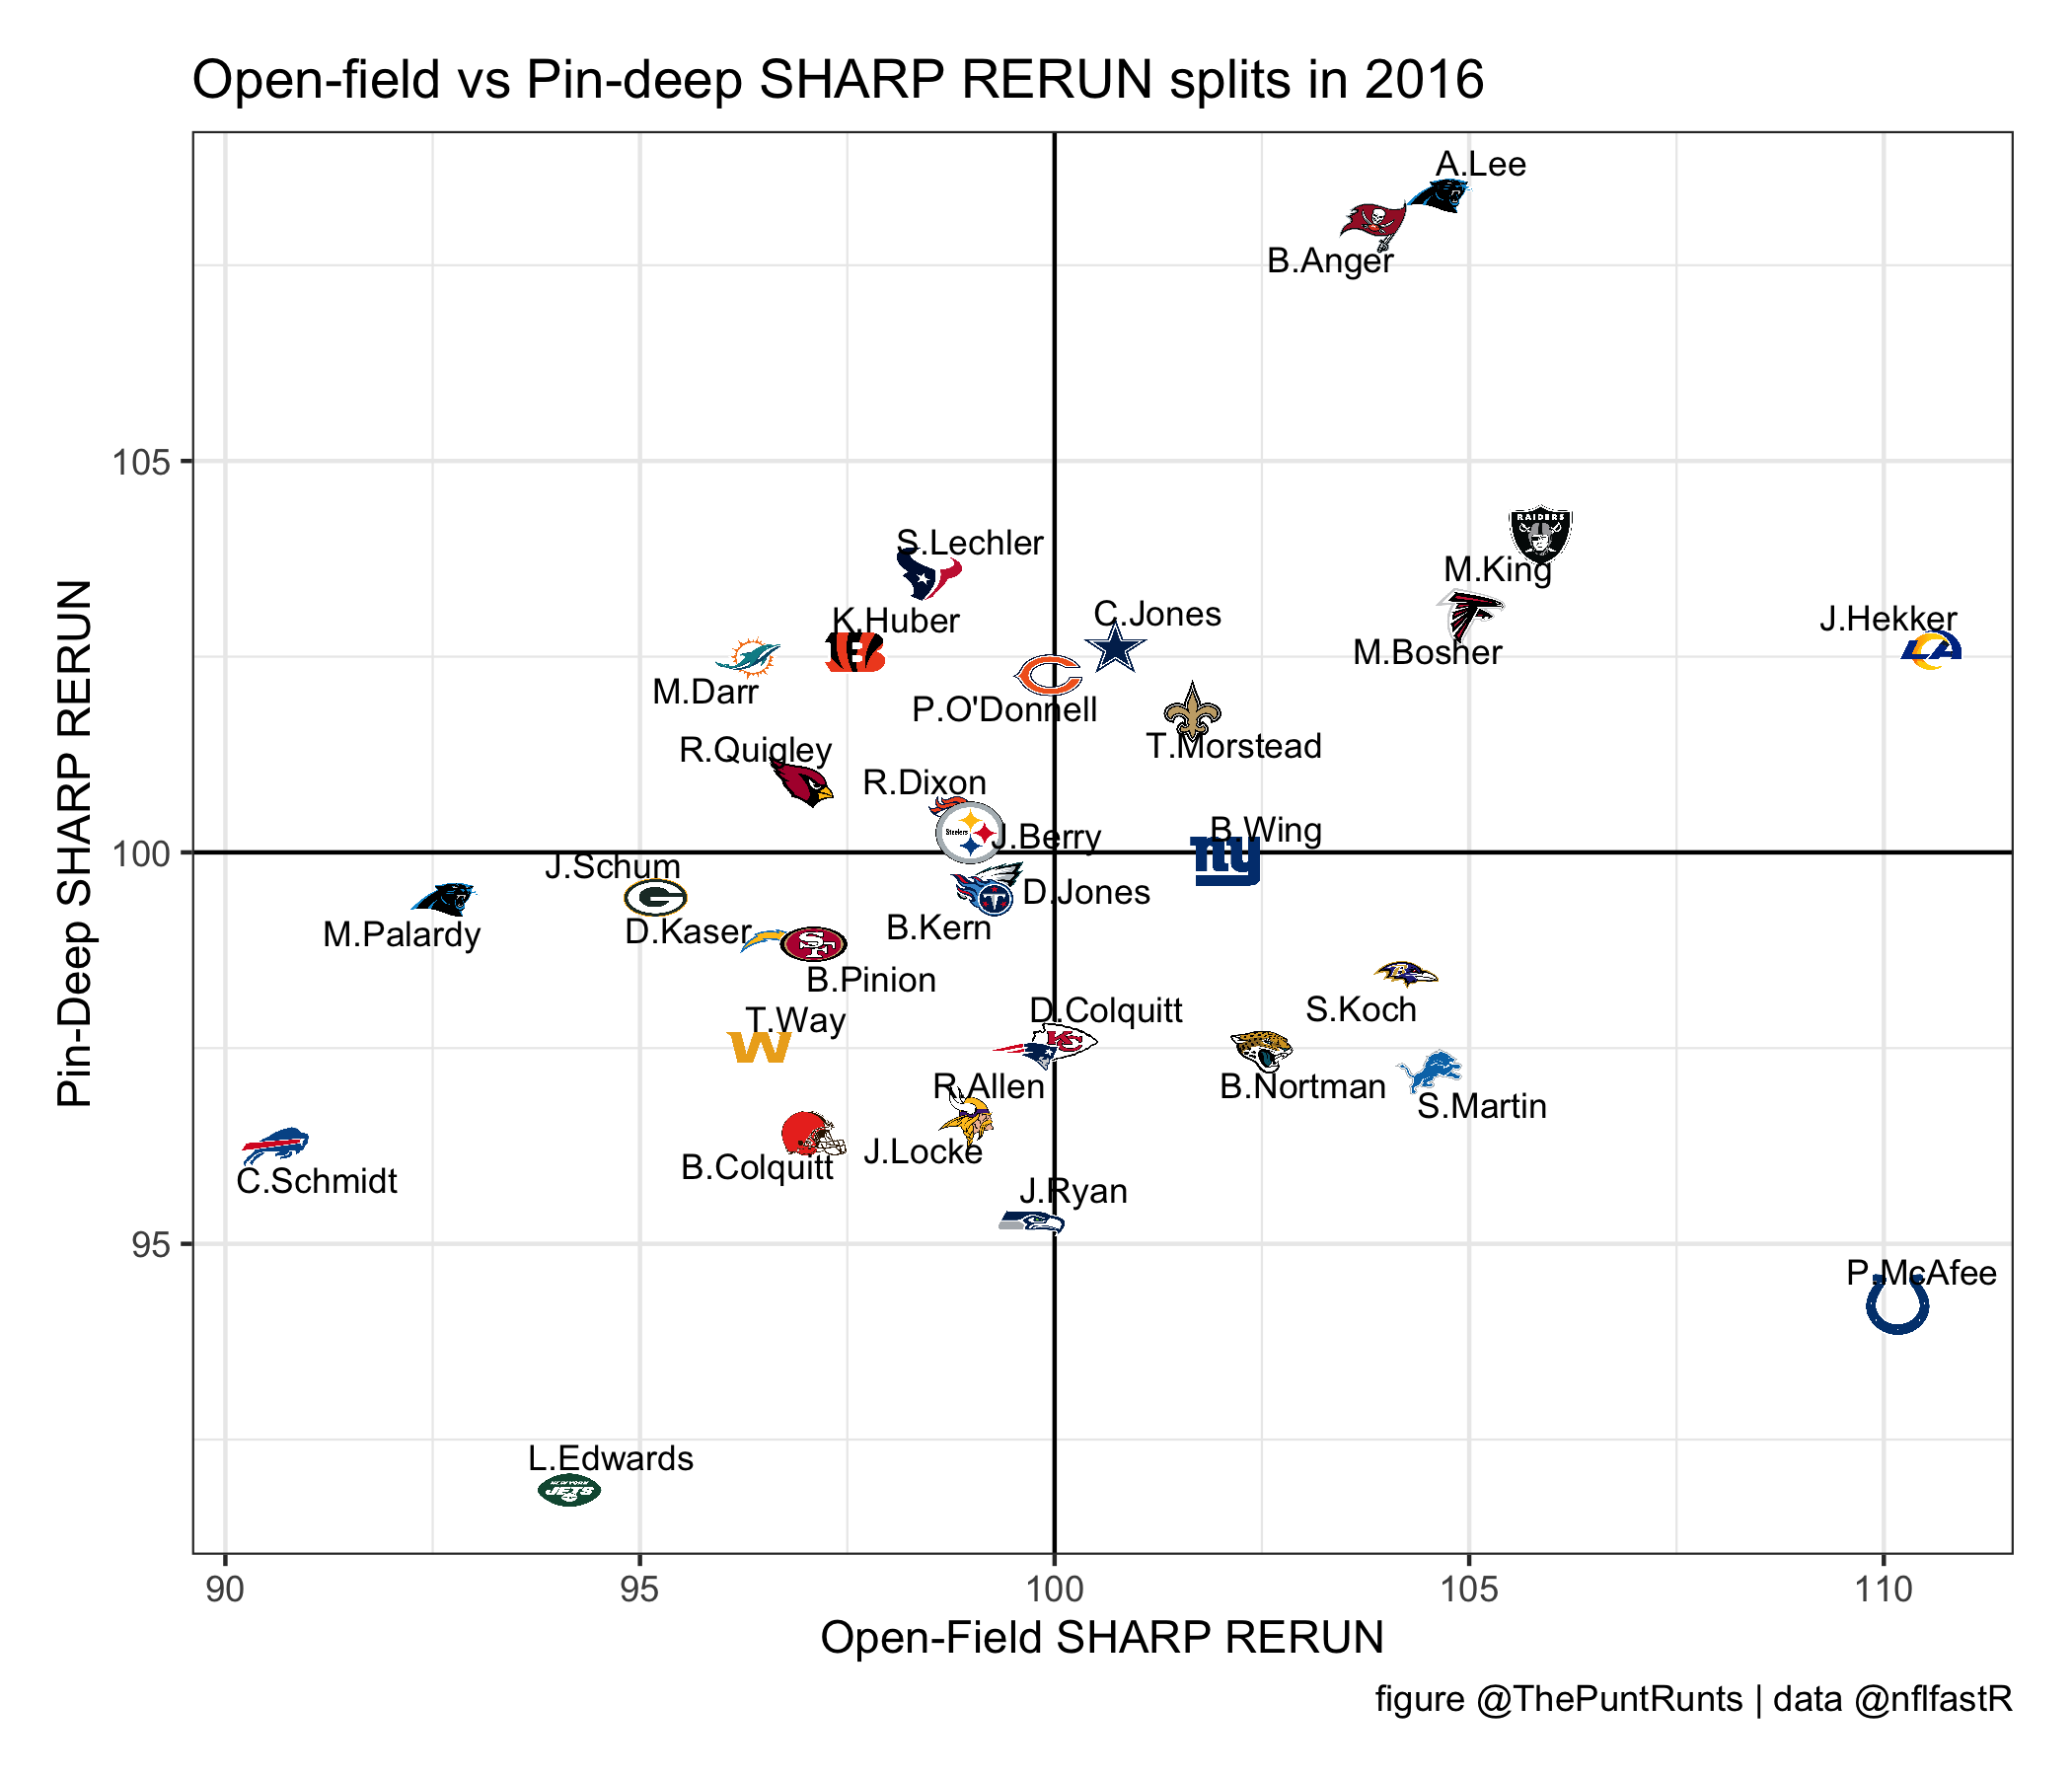
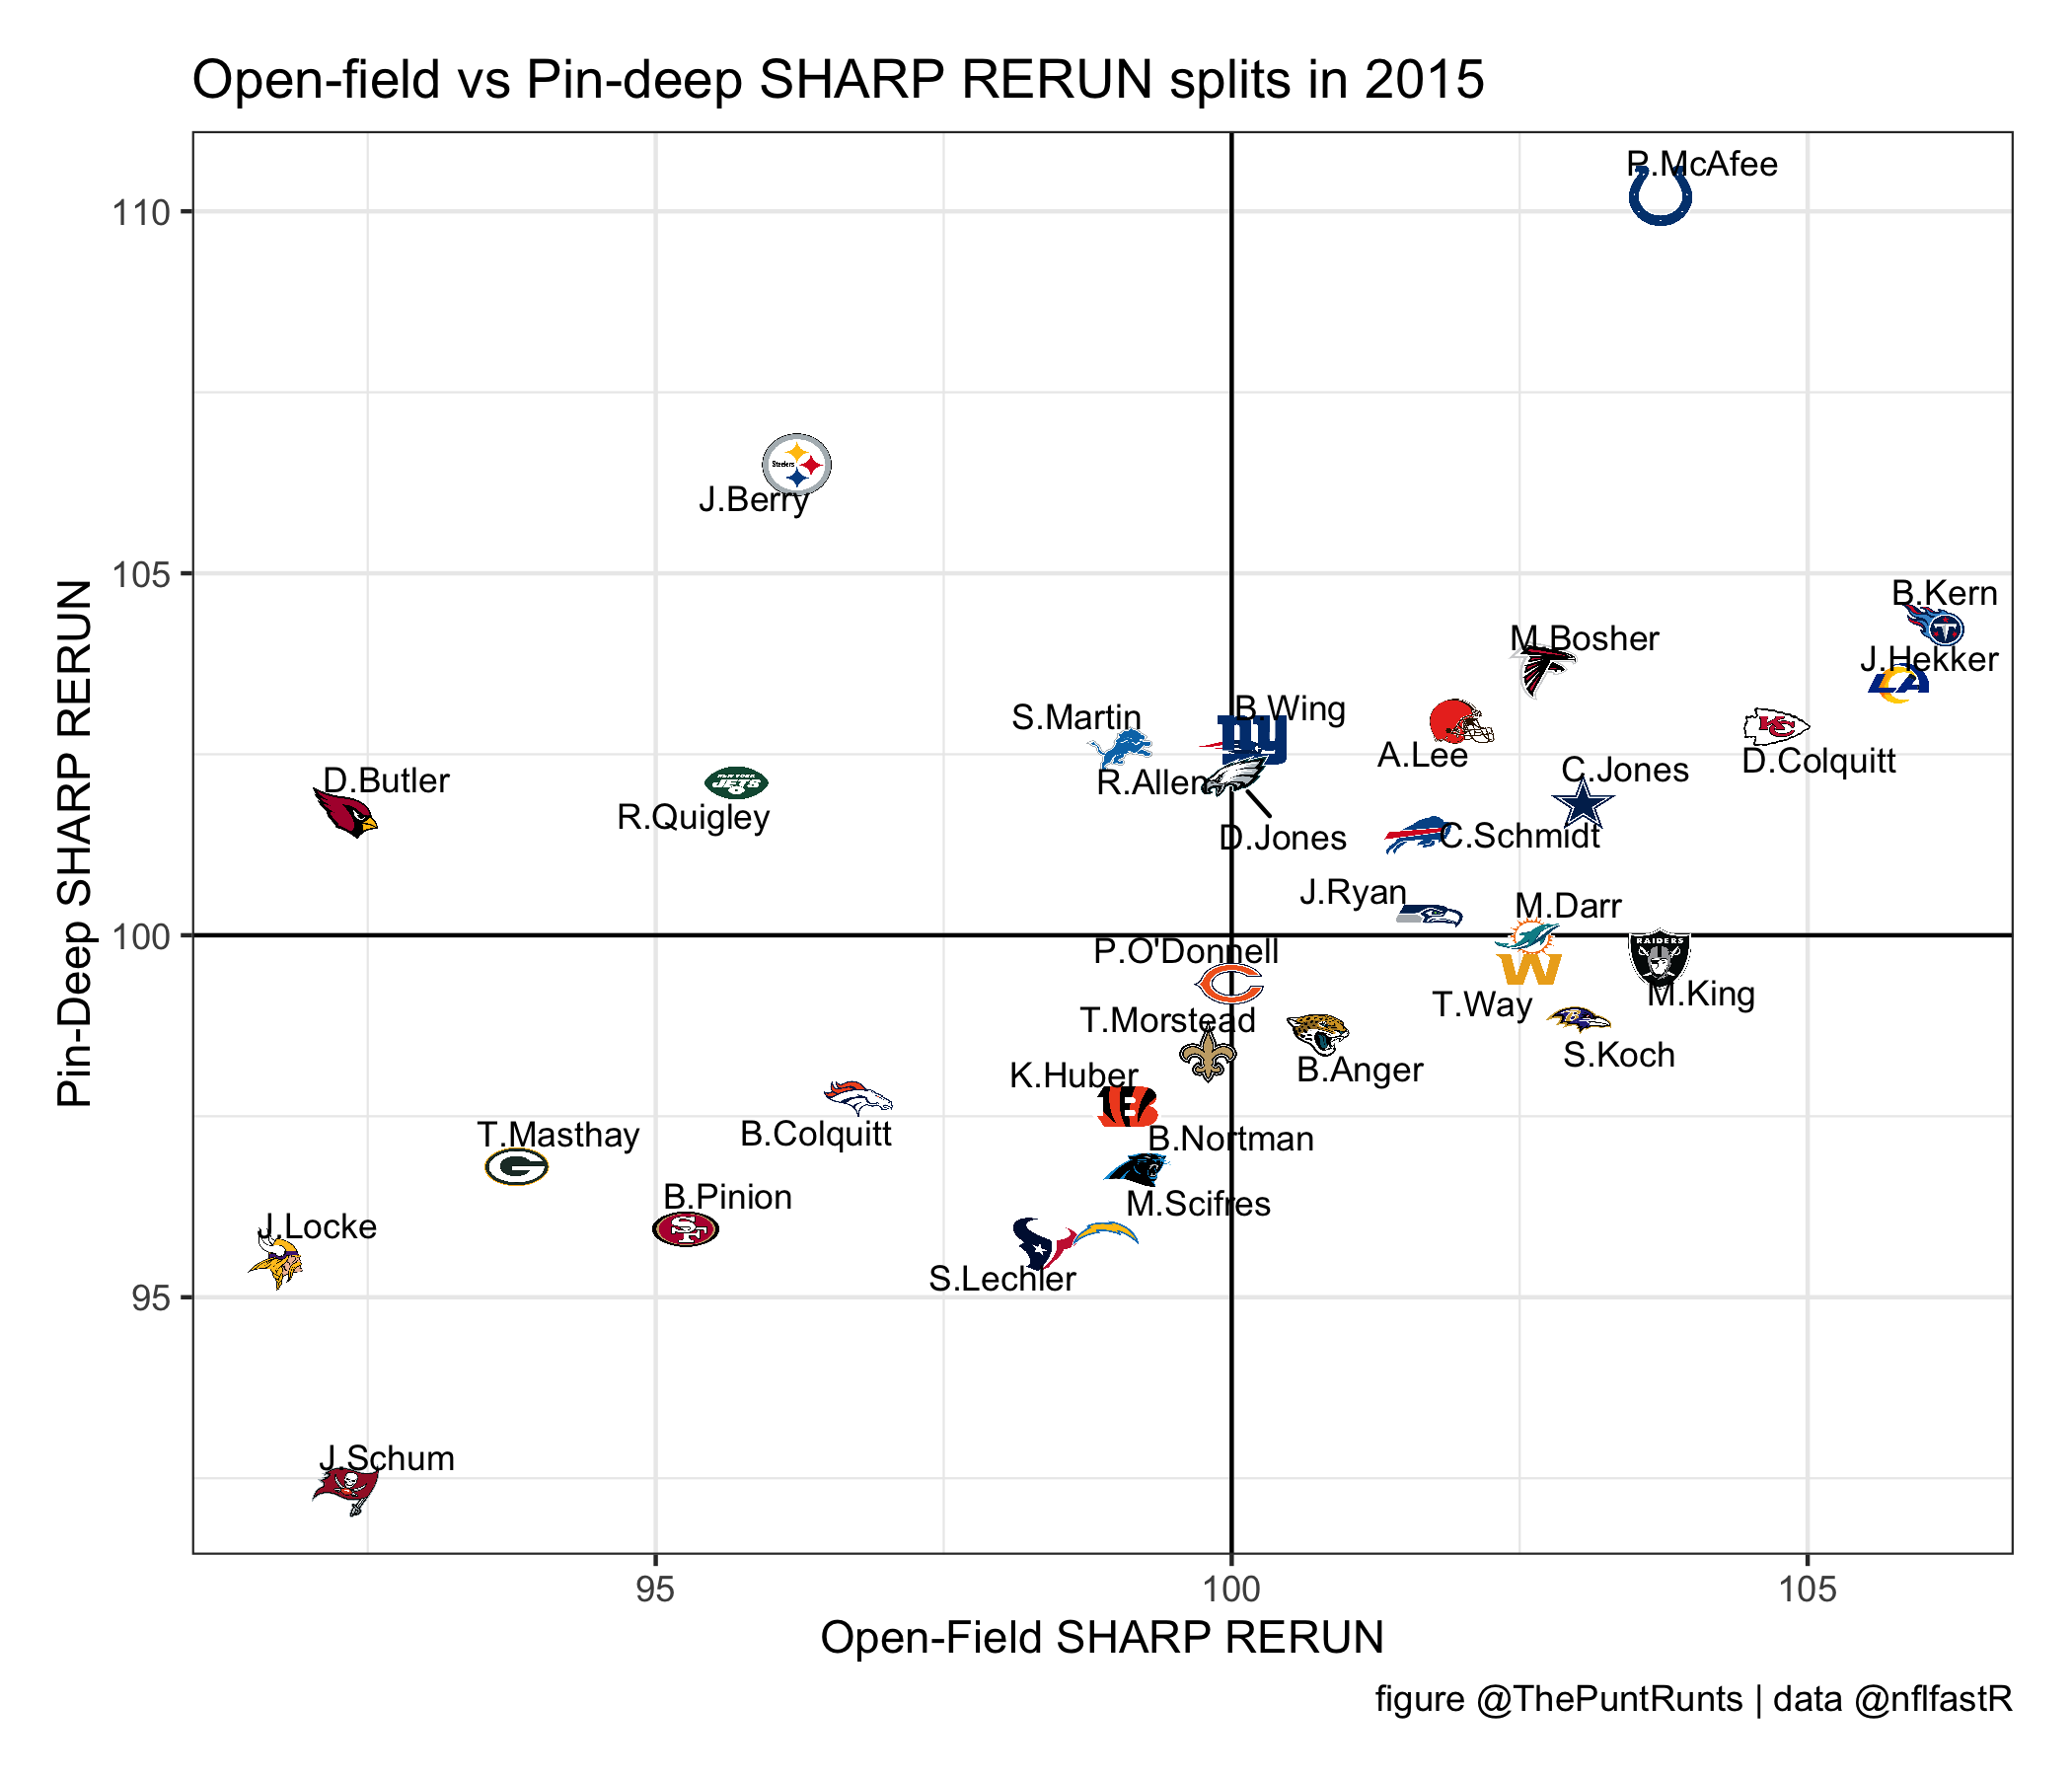
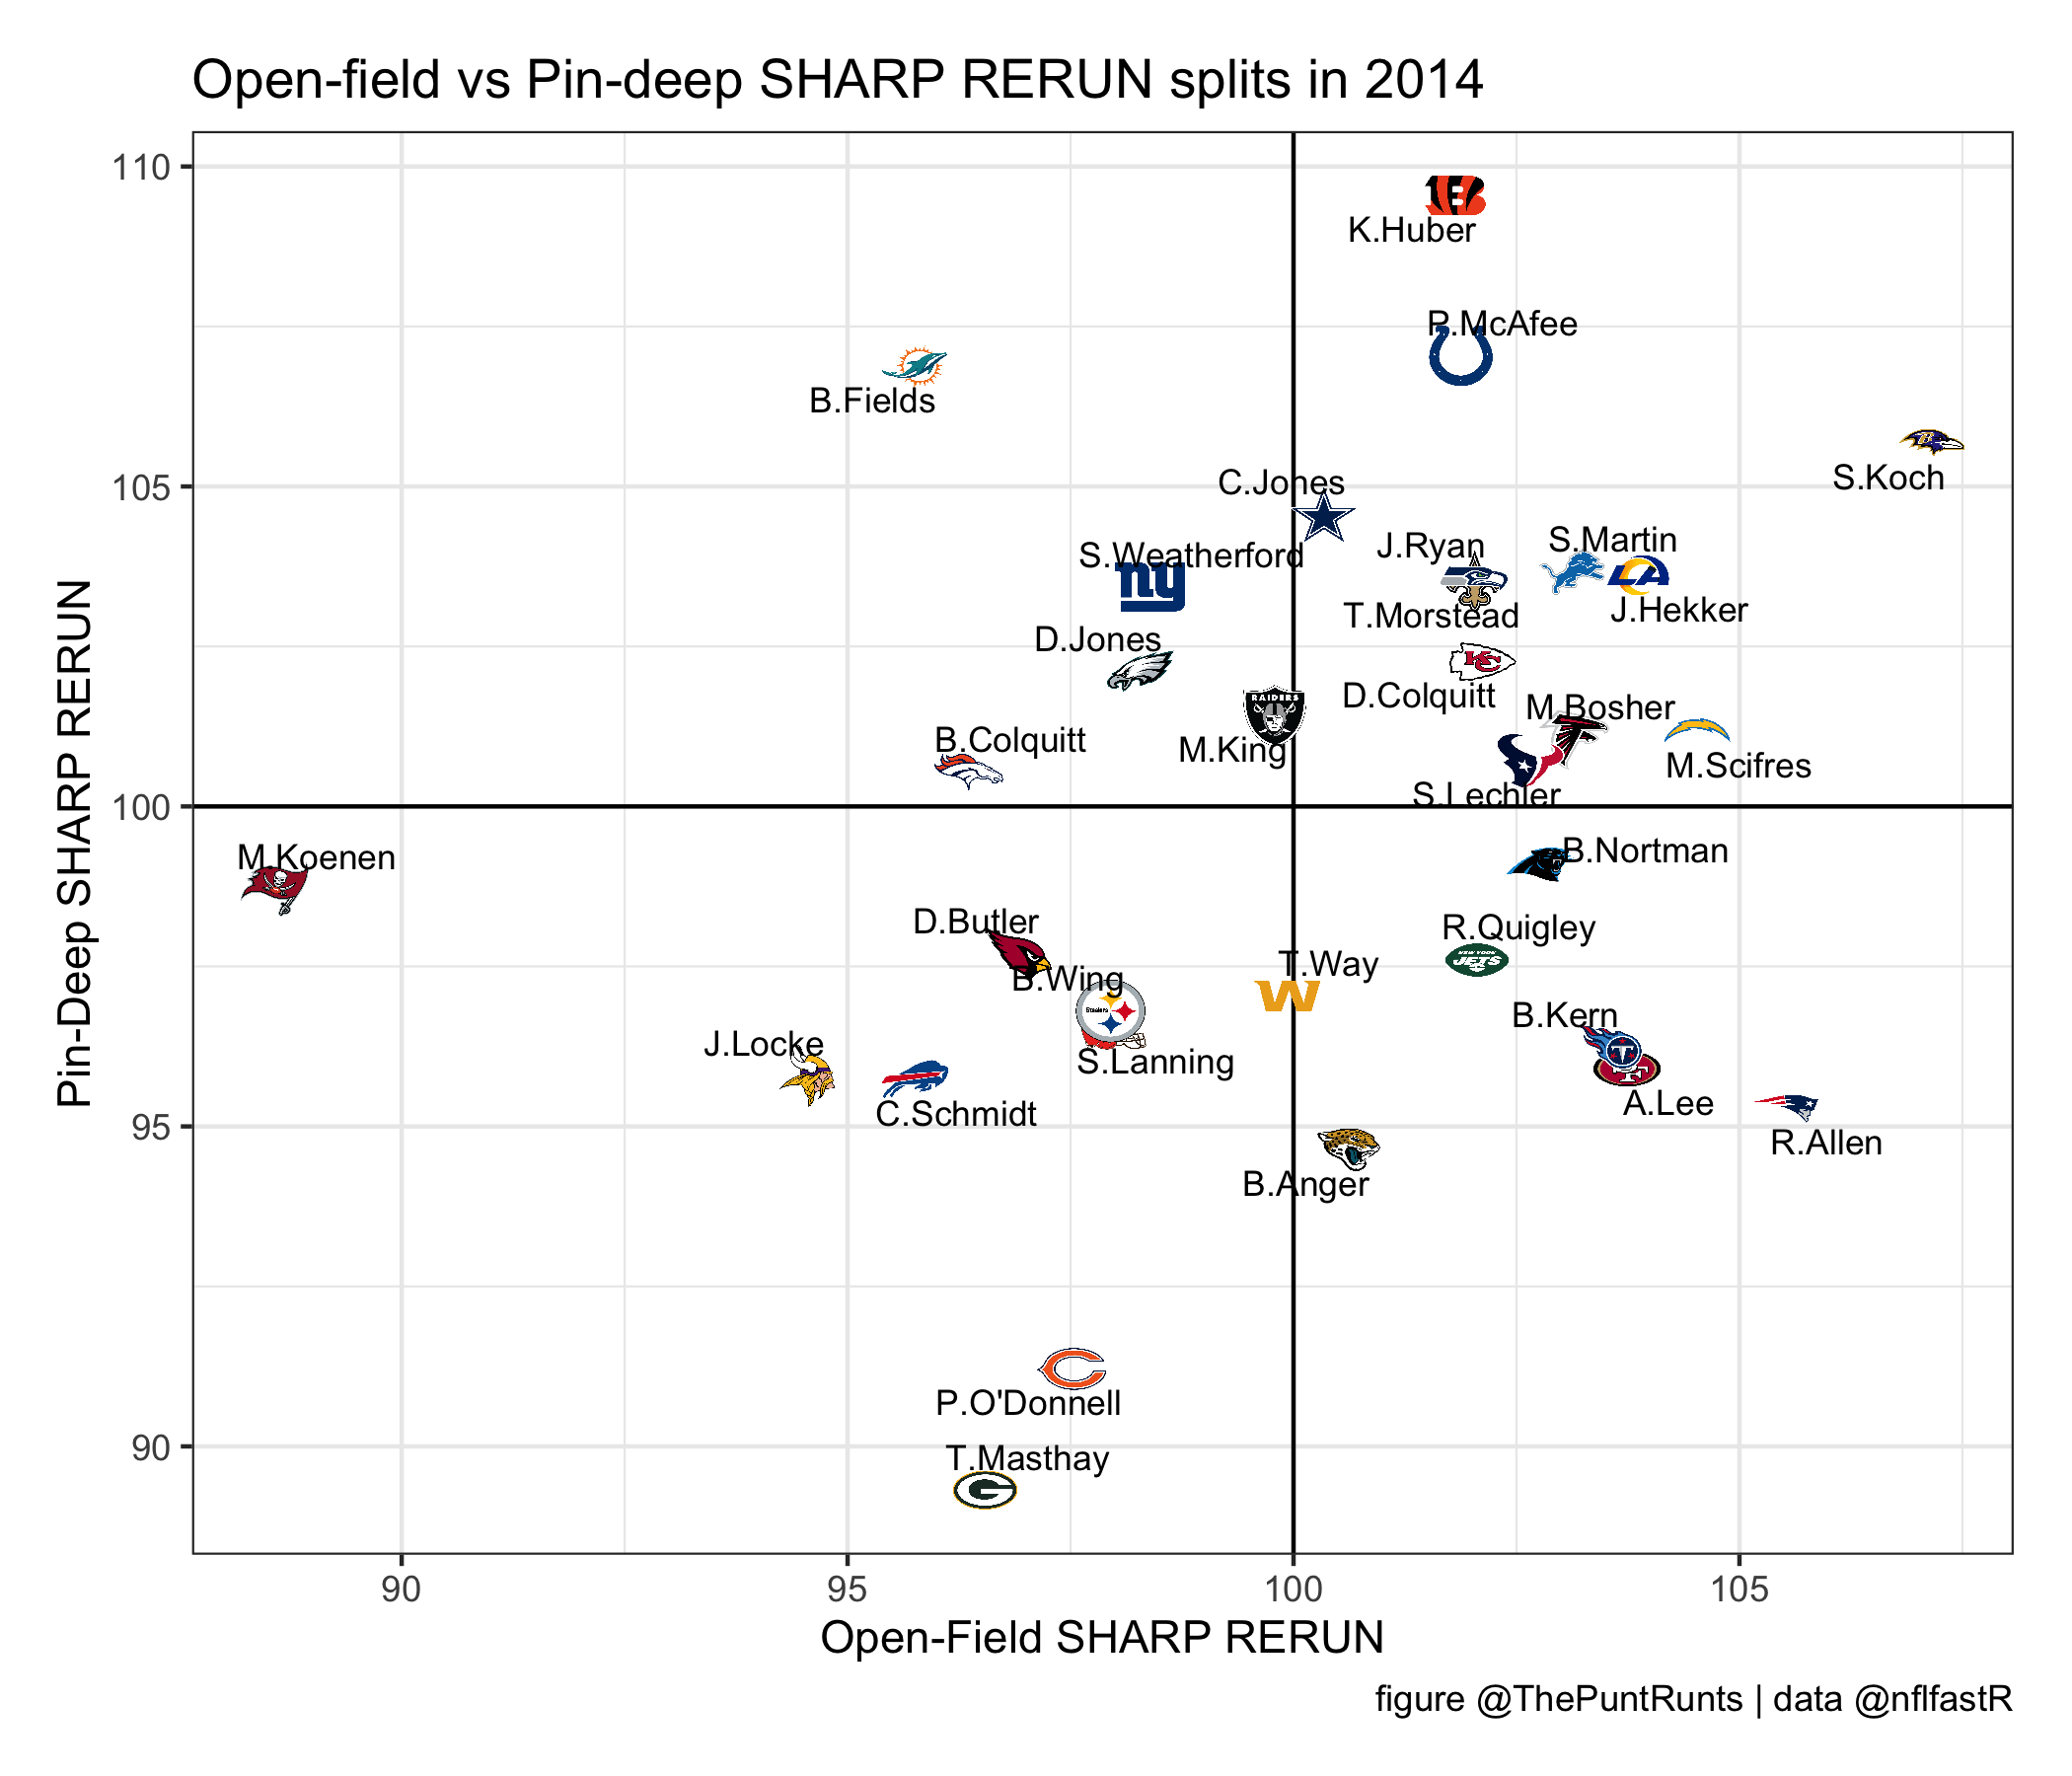
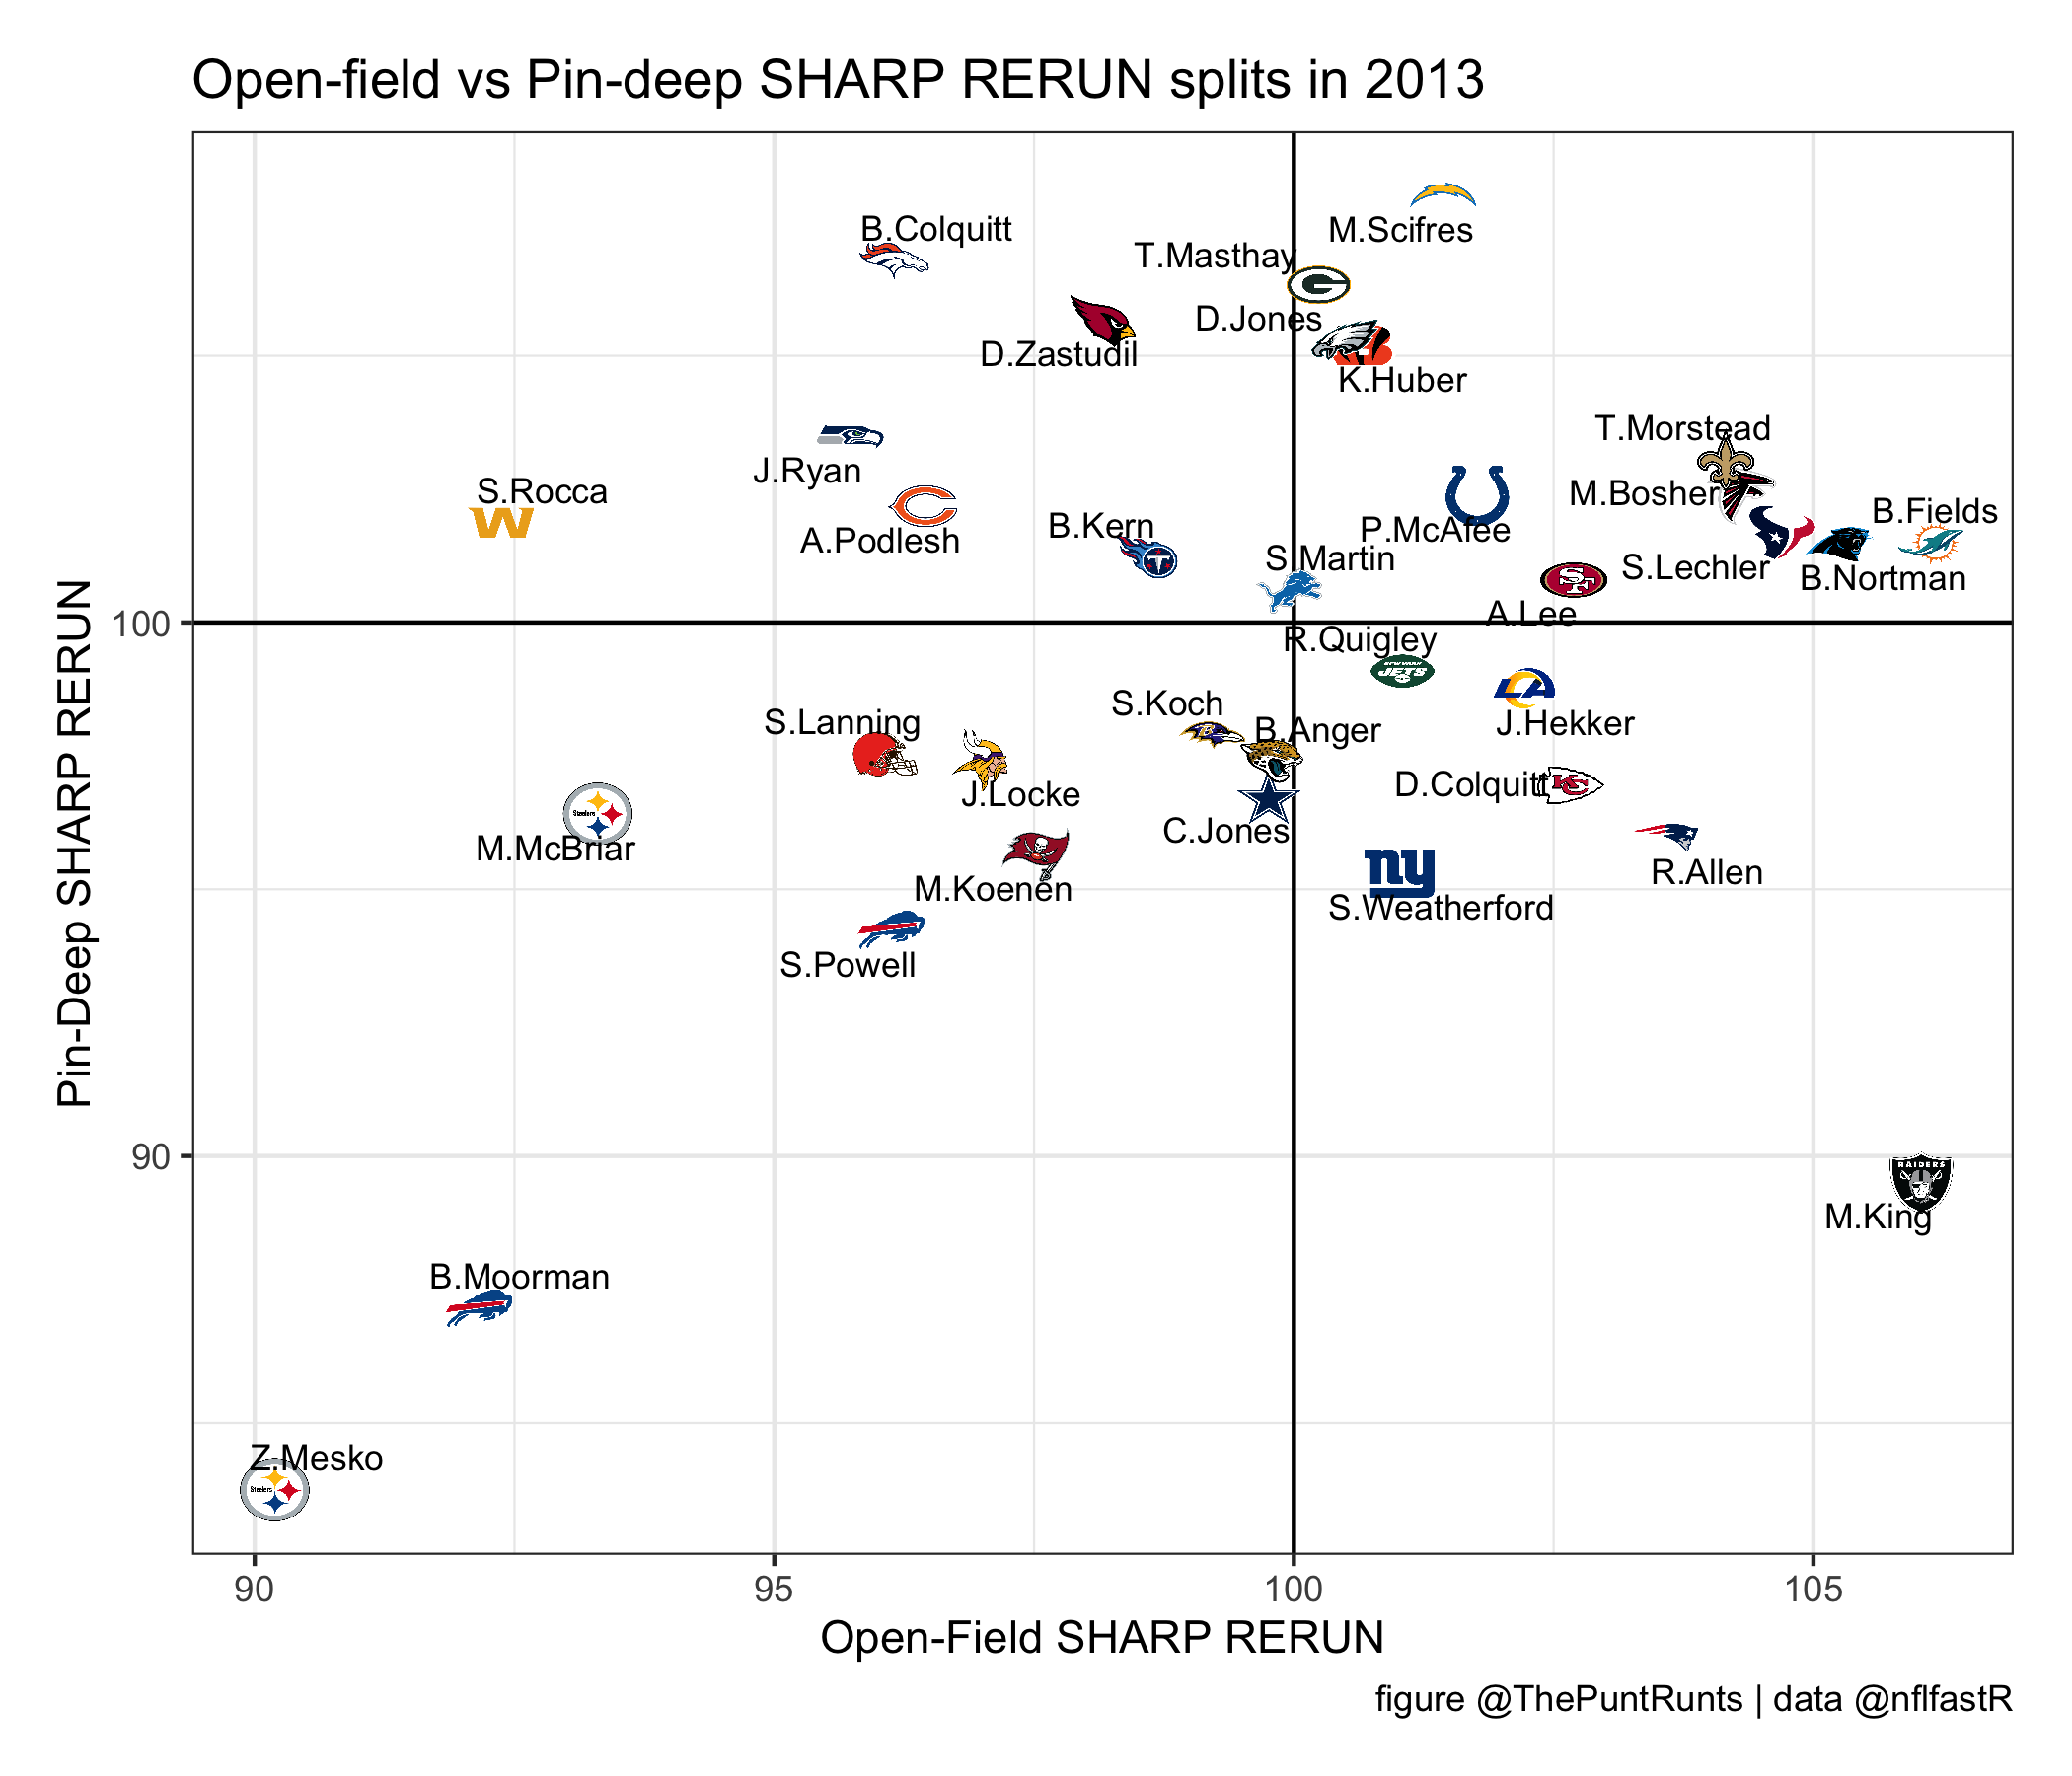
Is your punter a “big boot”, “precision specialist”, both, or neither?